Under the Defence Reform Act 2014, the SSRO must provide the Secretary of State with its assessment of the appropriate rates used to determine the contract profit rate for pricing qualifying defence contracts and qualifying sub-contracts. Part of the methodology is the categorisation of comparator companies into four activity types.
- Develop, Make and Support1
- Ancillary Services
- Construction
- Information Technology Services
The results of these groups are separately analysed and this factsheet describes the Information Technology Services group results.
For further information on the methodology used to calculate these rates please see the Single Source baseline profit rate and capital servicing rates methodology.
Information Technology Services
Companies undertaking comparable activities considered as ‘Information Technology Services’ (ITS) are expected to engage in the development, or operation and maintenance, of bespoke and complex IT systems; or the integration of off-the-shelf components or software to deliver a bespoke IT system/service. This could cover a broad range of IT management and consultancy services and IT system, software or application development. In addition, comparable companies may also provide the hardware for IT systems or networks, or the training necessary to operate or maintain them.
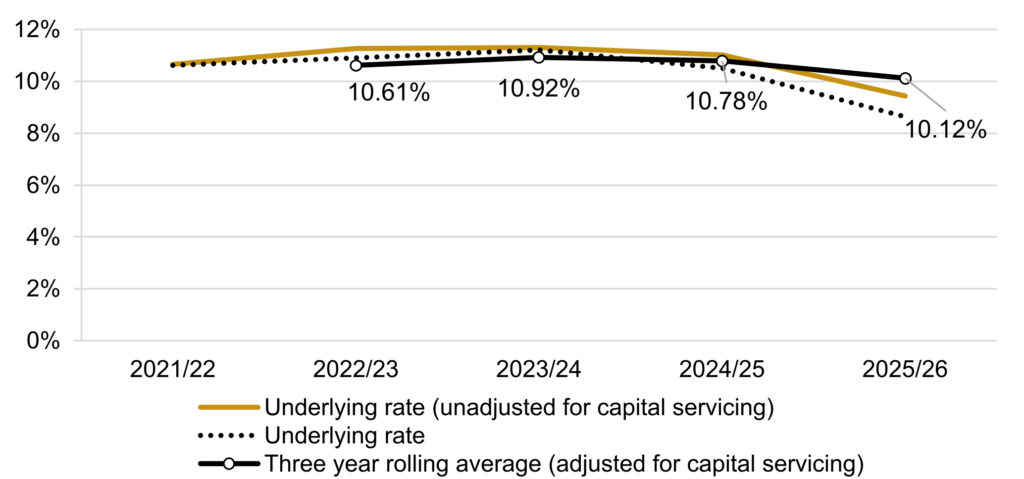
Profit on cost of production
| 2021/22 | 2022/23 | 2023/242 | 2024/25 | 2025/26 | |
|---|---|---|---|---|---|
| Underlying rate (unadjusted for capital servicing) | 10.65% | 11.26% | 11.31% | 11.02% | 9.43% |
| Capital servicing adjustment | -0.03% | -0.35% | -0.11% | -0.51% | -0.79% |
| Underlying rate | 10.62% | 10.91% | 11.20% | 10.51% | 8.64% |
| Three-year rolling average | 10.51% | 10.61% | 10.92% | 10.78% | 10.12% |
Note: The capital servicing adjustment accounts, at an aggregate level, for different levels of capital employed across the companies in the index and so sets a baseline upon which step 4 of the contract profit rate applies.
Data sources
For further information on the data selection approach please see section 7 of the Single Source baseline profit rate and capital servicing rates methodology. A company update search of the Orbis database was carried out on 1 November 2024 on data update number 354001 using software version 354. The financial data for the calculation was extracted from Orbis at the same time.
Median capital servicing adjusted return on cost of production
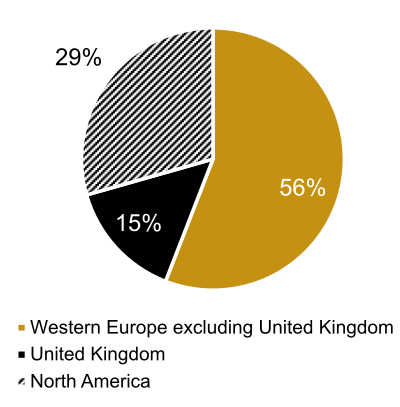
Proportion of Companies by country
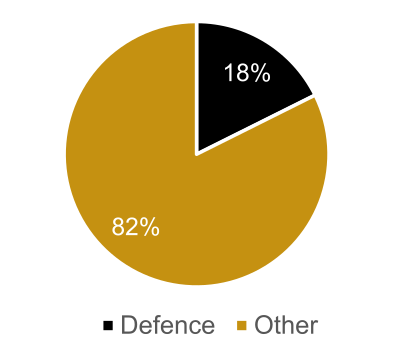
Proportion of companies with defence keyword
Supplementary statistics
| Number of companies | 35 |
| of which profit making | 34 |
| Aggregate turnover (£billions) | 106 |
| Total capital employed (CE) (£billions) | 7 |
| Average company CP:CE ratio | 14.13 |
Source: Orbis (Cash figures shown in rounded GBP Billions)
Names of companies in the index
| Accenture Public Limited Company | IT Link |
| Adesso SE | Kainos Group PLC |
| Akamai Technologies INC | Leidos Holdings, Inc. |
| Akhter Group Limited (J) | Logility Supply Chain Solutions INC |
| Allgeier SE | Manhattan Associates INC |
| Ansys INC | Mensch UND Maschine Software SE |
| Atos SE * | Mnemonic AS |
| Aubay | Performance Technologies S.A |
| Bjss Limited | Proact IT Group AB |
| Bouvet ASA | Progress Software Corporation |
| Caci International INC (J) | Prosource.It (UK) Ltd. |
| Cancom SE | PSI Software SE |
| Ciena Corp | Science Applications International Corp |
| Digia OYJ | Siili Solutions OYJ |
| DXC Technology Company | Sopra Steria Group SA |
| Gofore OYJ | Sword Group SE |
| Infotel | Tracsis PLC |
‘*’ Indicates that the company is a loss-maker in the year.
(J) Indicates a company which was not in the activity group last year but has been added this year.
- The ‘Develop, Make and Support’ activity type replaces the previous activity types of ‘Develop and Make’ and ‘Provide and Maintain’. Further information can be found in the published Q&A document. ↩︎
- This was the first assessment year for this activity group. The ITS rates for 2021/22 and 2022/23 are the historical profits of the 2023/24 comparator group, as the SSRO’s methodology did not include an ITS comparator group prior to this year. All other activity type factsheets represent the profit data of the groups that were assessed in that particular year. ↩︎