
Under the Defence Reform Act 2014, the SSRO must provide the Secretary of State with its assessment of the appropriate rates used to determine the contract profit rate for pricing qualifying defence contracts and qualifying sub-contracts. Part of the methodology is the categorisation of comparator companies into four activity types.
- Develop, Make and Support1
- Ancillary Services
- Construction
- Information Technology Services
The results of these groups are separately analysed and this factsheet describes the Construction group results.
For further information on the methodology used to calculate these rates please see the Single Source baseline profit rate and capital servicing rates methodology.
Construction
Companies undertaking comparable activities considered as ‘Construction’ are expected to deliver services in relation to the construction of buildings or other structures at fixed locations. Companies could provide such services either on a contract basis with designs and specifications received or using their own designs. Comparable companies may be responsible for the management of the construction project, and are likely to bear contract risk, procurement risk, staff risk and some quality control risk in respect of these activities. They are not expected to bear any significant property price risk in respect of these activities.
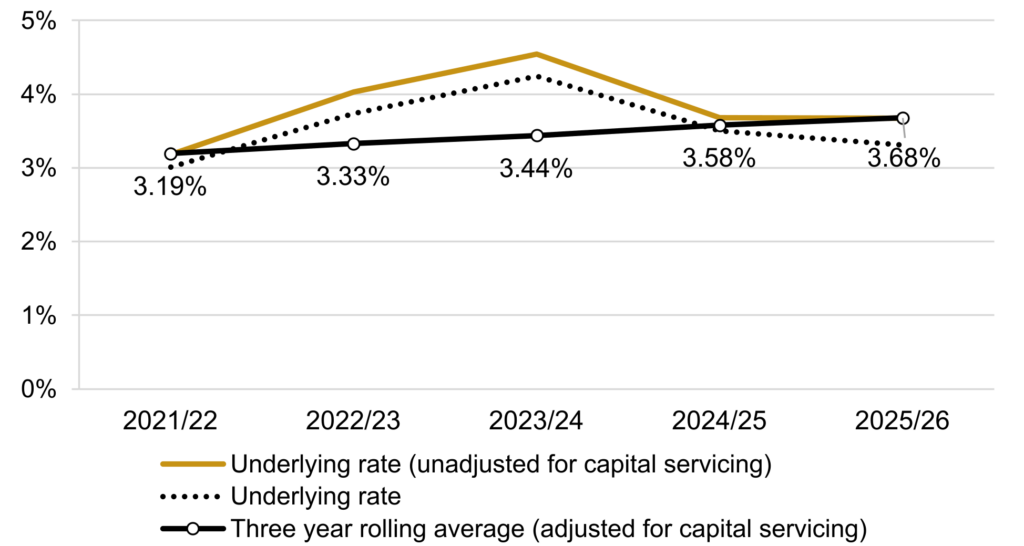
Profit on cost of production
| 2021/22 | 2022/23 | 2023/24 | 2024/25 | 2025/26 | |
|---|---|---|---|---|---|
| Underlying rate (unadjusted for capital servicing) | 3.18% | 4.03% | 4.54% | 3.68% | 3.67% |
| Capital servicing adjustment | -0.17% | -0.29% | -0.30% | -0.18% | -0.36% |
| Underlying rate | 3.01% | 3.74% | 4.24% | 3.50% | 3.31% |
| Rolling average2 | 3.19% | 3.33% | 3.44% | 3.58% | 3.68% |
Note: The capital servicing adjustment accounts, at an aggregate level, for different levels of capital employed across the companies in the index and so sets a baseline upon which step 4 of the contract profit rate applies.
Data sources
For further information on the data selection approach please see section 7 of the Single Source baseline profit rate and capital servicing rates methodology. A company update search of the Orbis database was carried out on 1 November 2024 on data update number 354001 using software version 354. The financial data for the calculation was extracted from Orbis at the same time.
Median capital servicing adjusted return on cost of production
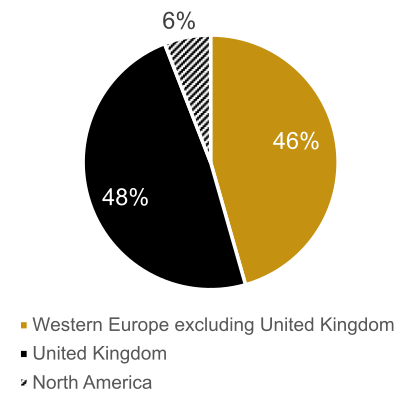
Proportion of Companies by country
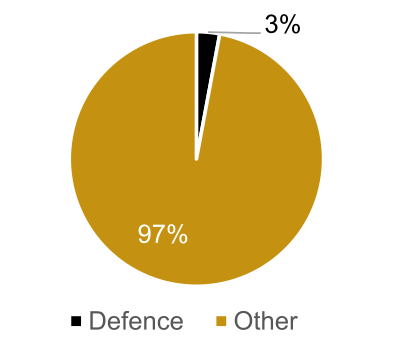
Proportion of companies with defence keyword
Supplementary statistics
| Number of companies | 77 |
| of which profit making | 68 |
| Aggregate turnover (£billions) | 210 |
| Total capital employed (CE) (£billions) | 7 |
| Average company CP:CE ratio | 29.57 |
Source: Orbis (Cash figures shown in rounded GBP Billions)
Names of companies in the index
| 3B Construction LTD | Lareco Infra |
| ADF Group INC | LES Macons Parisiens |
| Aecon Group INC | Lindum Group Limited |
| AF Gruppen ASA | M R Stephenson Limited |
| Balfour Beatty PLC | M.P.B. Structures LTD |
| Bermar Building Company Limited | Mace Finance Limited |
| Billington Holdings PLC | Martifer Sgps S.A. |
| Bird Construction Inc. | Mitchellson Formwork & Civil Engineering Limited * |
| Bouygues (J) | Morgan Sindall Group PLC |
| Bowmer and Kirkland Limited | NG Bailey Group Limited (J) |
| Bravida Holding AB | Northern Bear PLC |
| Bridgetown Holdings Limited | Nouveaux Batisseurs Associes |
| Byggpartner I | Ohob Holdings Limited |
| Dalarna Holding AB * | Oliver Connell and SON Limited |
| Chrysalis * | Peab AB |
| Cobelba – Sociedade de Construcao Civil, S.A. | Porr AG |
| Conlon Holdings Limited | Putkiwuorio Oy |
| Consti OYJ | Rakennusliike J. Malm Oy |
| Dobloug Holding AS | Rakennuspetaja Oy |
| Ecosoer Holding AS | Renelec Group Limited |
| Edimarante – Sociedade de Construcoes, S.A. | Royal BAM Group NV |
| Elektro AS | Simpson (York) Holdings Limited |
| Emcor Group INC | Skanska AB |
| EW Beard (Holdings) Limited | Sorgem Societe D Economie Mixte du VAL D Orge * |
| Feltham Group Limited | stahl + verbundbau gesellschaft fuer industrielles bauen m.b.H. |
| Fordy Thompson (Holdings) Limited | Strabag SE |
| Foundation Piling (Holdings) Limited | Subsea 7 SA * |
| Galliford TRY Holdings PLC | Tclarke PLC |
| Groupe 1000 | TOR Entreprenoer AS |
| Grupo Empresarial SAN Jose S.A. | Tutor Perini Corporation * |
| Haandverkskompaniet AS | VAN Huele * |
| Haley Securities Limited | Varden Gruppen AS |
| Hardwicke Investments Limited * | Veidekke ASA |
| Harper Group Management Limited | Vinci |
| Highgrove Group PLC * | Wates Group Limited |
| Implenia AG | Westcliffe Holdings Limited |
| John Weaver (Holdings) Limited | William Hare Group Limited |
| K 21 Entreprenad AB | Winvic Group Limited |
| Kier Group PLC | WYN Construction Limited |
* Indicates that the company is a loss-maker in the year.
(J) Indicates a company which was not in the activity group last year but has been added this year.
- The ‘Develop, Make and Support’ activity type replaces the previous activity types of ‘Develop and Make’ and ‘Provide and Maintain’. Further information can be found in the published Q&A document. ↩︎
- A four-year average was used for 2022/23; a three-year average for pre-2022/23 and a three-year average (excluding 2022/23 underlying rate) for 2023/24 onwards. The pre-2021/22 underlying rates used for the three-year average were: 2019/2020: 3.50% and 2020/21: 3.07%. ↩︎