The baseline profit rate and capital servicing rates continue to be the most significant determinants of contract profit rates and help ensure pace and agility in the way that single source contracts can be priced. The Secretary of State for Defence has now announced his determination of the rates for this year and we welcome the Secretary of State’s decision to accept our assessment. The baseline profit rate for 2024/25 is 8.24 per cent, 0.05 percentage points down on last year and the capital servicing rates are on average up by 0.96 percentage points to 2.66 per cent. These rates will apply to qualifying contracts entered into from 01 April 2024 and can be found in The Gazette and in the SSRO’s guidance on the baseline profit rate and its adjustment.
This year’s assessment uses the SSRO’s established methodology, which provides a predictable and stable basis for the MOD and its suppliers to agree profit rates for single source defence contracts. This process has been further streamlined this year, lowering the steps from six to only four, reducing complexity and increasing the accessibility of the regime. The baseline profit rate is the first of four steps that together determine the rate of profit on a contract, and from which a range of contract profits can be agreed to suit the specific contract in question, at rates comparable to those earned by the MOD’s main suppliers on their broader portfolio of business.
We continue to promote transparency about our rates assessment and have again published information on our methodology and its application to help anyone who may wish to scrutinise or replicate the approach we have taken this year. Further details of the SSRO’s assessment and the impacts of the amendments to the regulations can be found in the SSRO’s key questions and answers on this year’s rates assessment.
In making this year’s assessment, we have also considered current economic conditions, such as higher inflation and interest rates, and have taken measures to ensure these are reflected fairly in the rates. For example, we have recommended higher capital servicing rates to reflect the higher borrowing costs for industry. Limited change in the BPR this year supports a stable ongoing position that helps industry plan and promotes investment, consistent with the defence and security industrial strategy. We believe that our assessment is both robust and appropriate and supports the SSRO’s aims to ensure good value for money in government expenditure and fair and reasonable price for contractors.
In addition to the standard baseline profit rate, the SSRO has recommended a baseline profit rate of zero to apply to contracts between the Secretary of State and a company wholly owned by the UK Government, where both parties agree to this. This rate was introduced in 2021 by the Secretary of State and the reasons for its introduction can be found here: https://www.thegazette.co.uk/notice/4579528. The step 4 SSRO funding adjustment from the list of rates that the SSRO is required assess and it will no longer feature in the determination of profit rates of QDCs or QSCs.
Key questions and answers regarding the SSRO’s Single source baseline profit rate, capital servicing rates and funding adjustment methodology
This document should be read in conjunction with the SSRO publication Single Source Baseline Profit Rate, Capital Servicing Rates and Funding Adjustment Methodology and Guidance on the Baseline Profit Rate and its Adjustment.
Terms and definitions
Comparability principle: The aim of the baseline profit rate is to provide the starting point in the determination of the contract profit rate. It is set with reference to the returns of companies whose economic activities are included in whole or in part in the activity types that contribute to the delivery of Qualifying Defence Contracts (QDCs) and Qualifying Sub-Contracts (QSCs).
Baseline profit rate: Step 1 of the 4-step process to calculate the contract profit rate of a contract that falls under the Single Source Regulations. The baseline profit rate is the average of the underlying rates for the last three years.
Underlying rate: The median rate of profit (return on cost of production) based on the performance of the companies in a comparator group over a financial year. The SSRO reports this before and after the application of the capital servicing adjustment.
Return on cost of production: The measure of profit used as the basis for the underlying rates and baseline profit rate:
Capital servicing adjustment: An adjustment to the return on cost of production to account for the levels of fixed capital and working capital employed by companies in the comparator groups. A corresponding adjustment is made in the pricing of individual contracts by an adjustment at step 4 of the contract profit rate.
Activity type: A group of economic activities, defined by the SSRO, which correspond to types of activity that contribute to the delivery of QDCs and QSCs.
Comparable companies: A company whose economic activities are included, in whole or in part, within an activity type.
Comparator group: A group of comparable companies undertaking one or more of the economic activities which make up an activity type.
The baseline profit rate
1. Why does the SSRO calculate a baseline profit rate and how is it done?
The Defence Reform Act 2014 (the Act) requires the SSRO to provide the Secretary of State with an assessment of the appropriate baseline profit rate (BPR) for each financial year. The BPR can change annually to reflect what markets’ have recently determined as rates of profit on comparable activities, which we consider to be a fair basis for the assessment. Year on year changes may be small but accumulate over time to ensure the profit of single source contracts do not drift away from competitive market outcomes.
The BPR is an average of the actual profit rates of companies whose activities are comparable to those that contribute to the delivery of MOD single source contracts. The SSRO categorises those activities under the headings ‘Develop and Make’ and ‘Provide and Maintain’ and companies are selected into those comparator groups based on the nature of their activities. The median profit rate of a comparator group in each year is called the underlying rate.
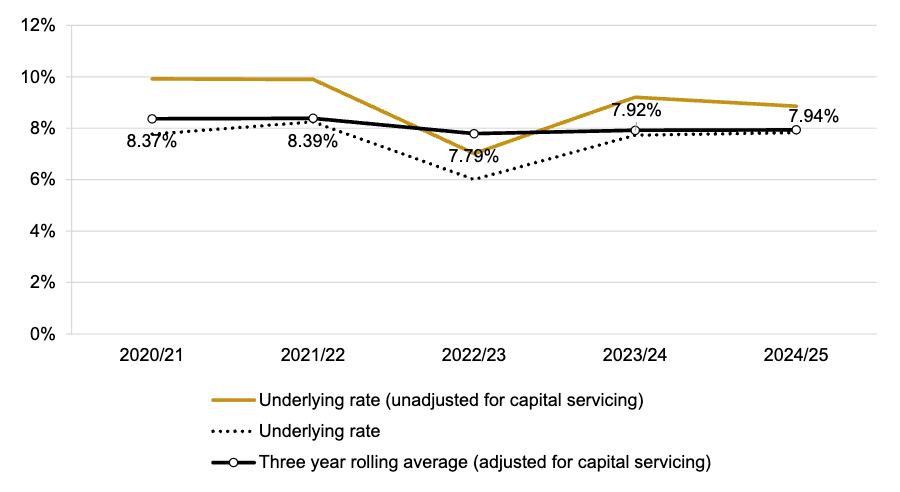
2. What is the baseline profit rate change this year and why has it changed?
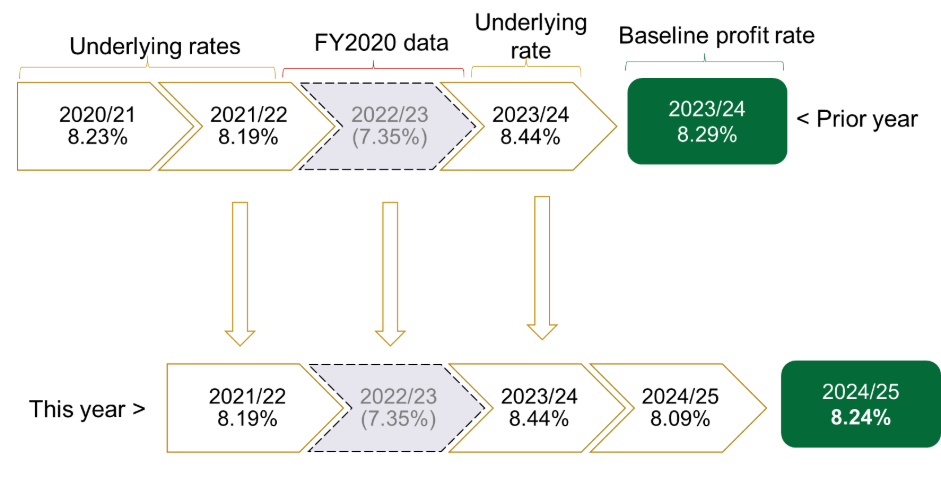
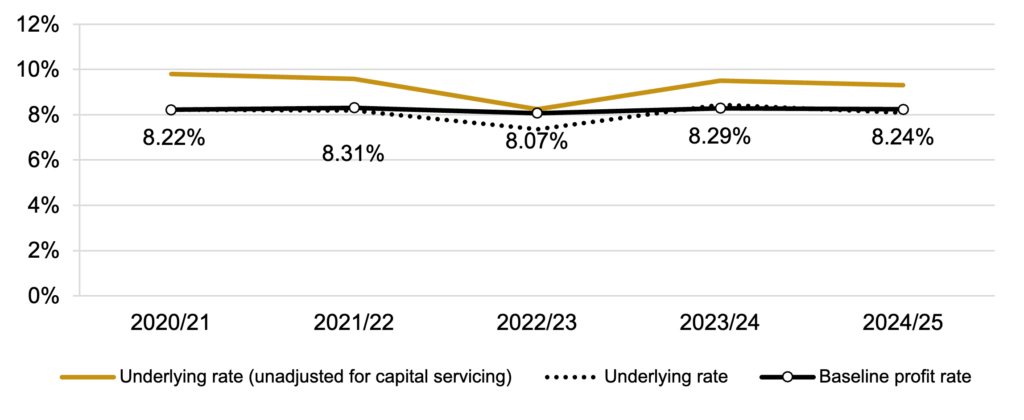
The baseline profit rate (BPR) for 2024/25 is 8.24 per cent. The 2024/25 BPR is the rolling average of the underlying profit rate for the current year and two previous years, excluding certain data from the period of the COVID-19 pandemic*. This year’s rate is 0.05 percentage points lower than last years. This is because a higher underlying rate from 2020/21 has dropped out of the rolling average and been replaced with a lower rate this year. This is shown in figure 1.
Figure 1 – Rolling average changes to the baseline profit rate
The underlying rate for this year which measures the average rate of profit of the comparator companies is 9.31 per cent, down on last year’s rate of 9.5 per cent. A further adjustment related to interest rates of -1.22 percentage points has then been applied (-1.06 per cent last year), resulting in the figure used in the rolling average of 8.09 per cent. This reduction to the underlying rate is higher than last year, reflecting higher interest rates. There is a compensating upward increase when contract profit rates are agreed for individual contracts known as the capital servicing adjustment to ensure that contractors receive an appropriate and reasonable return on the capital. Questions 17 set out this process and the reasons for it in more detail.
* The period excluded is the latest year ending on or before 31 March 2021 that is addressed by the financial statements of each comparator company. For most comparator companies this is the year ended 31 December 2020 but some company financial statements cover different time periods, for example the year ended 31 March 2021, or the year ended 30 June 2020.
3. What impact has higher inflation and interest rates had on this year’s assessment?
The BPR remains at a similar level to earlier periods with lower rates of inflation and interest rates. The stabilising features of the SSRO’s methodology mitigates the impact of short term economic shocks and allows for any longer lasting change to be reflected in the BPR in a predictable and measured way. Figure 2 shows the average profit rate of companies included in this baseline profit rate and producer price inflation over the same period.
Inflation is primarily reflected in the price and profit of QDCs and QSCs through the allowable costs, rather than changes in the baseline profit rate. Any impact will depend on the pricing method which allocates cost risk between the parties to the contract, specific contract terms and conditions, and any final price adjustment, which will all come together to determine the final contract price.
The capital servicing adjustment ensures that changes in the cost of borrowing (interest rates), which may change in response to inflation, are reflected in profit and prices in a transparent and economically rational manner. When interest rates increase, this adjustment process will tend to produce higher contract profit rates for contractors with relative higher capital intensive activities and associated financing requirements.
Figure 2 – Baseline profit underlying rate and inflation data
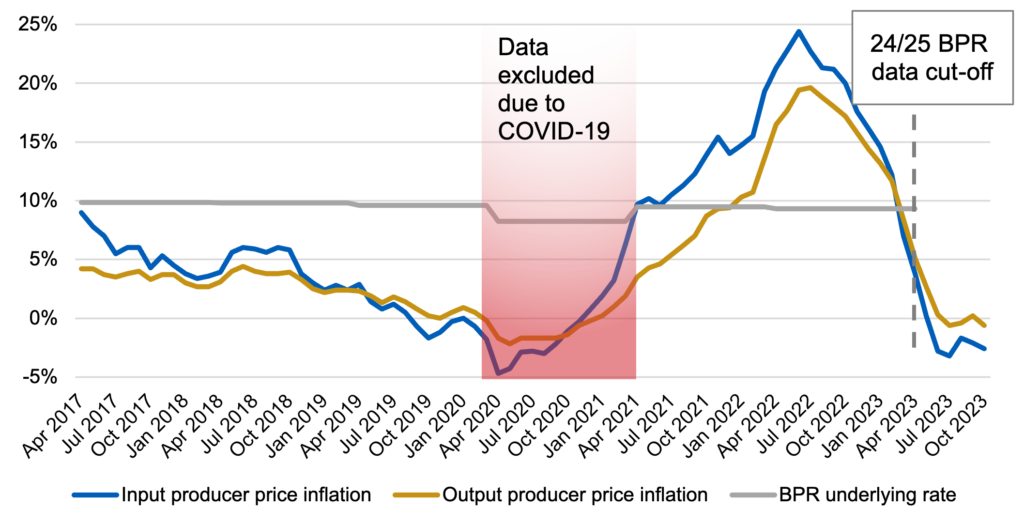
Source: Office for National Statistics and SSRO calculations
4. What is the impact of the lower baseline profit rate on the defence industry and how much will it save UK taxpayers?
The implications of a decrease in the BPR for the taxpayers will depend on how all four of the steps which determine the contract profit rate are applied by the MOD and contractor. In addition, the performance of the contractor, the pricing method which allocates cost risk between the parties to the contract, specific contract terms and conditions, and any final price adjustment, will all come together to determine the final contract price. In the short term, prices may therefore decrease or increase alongside a change in the BPR.
Figure 3 shows the average contract profit rates of contracts entered into each year and demonstrates that changes in contract profit rates may not always mirror changes in the BPR, as a result of those other factors.
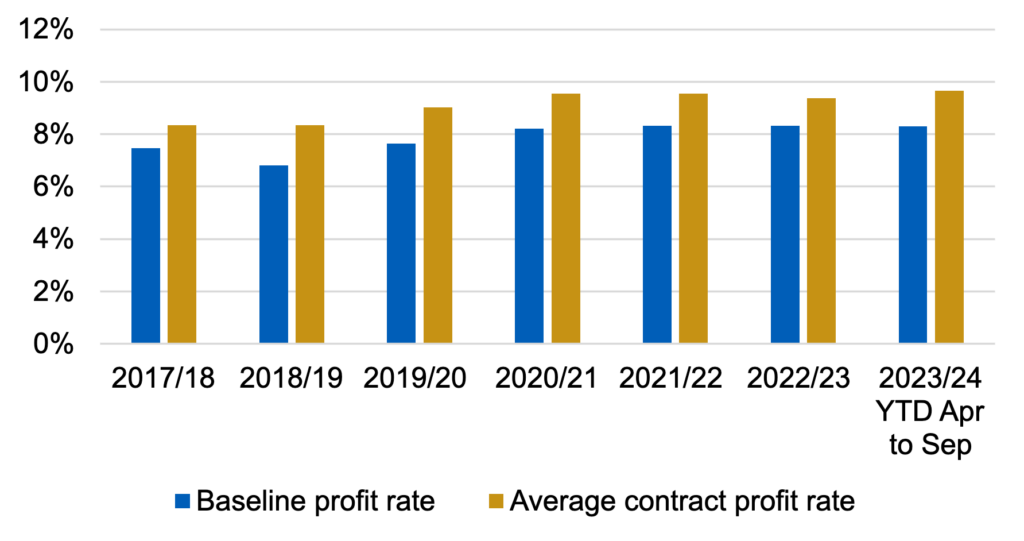
Figure 3: Baseline profit rate and average (mean) estimated contract profit rate by financial year
Source: SSRO (2023) Quarterly Qualifying Defence Contract Statistics: Q2 2021/22, Table 3. Available at www.ssro.gov.uk
Note: The differences between the baseline profit rate and the observed contract profit rates are due to the application of steps 2-6 in the calculation. For more details see the Guidance on the Baseline Profit Rate and its Adjustment.
5. What are the lowest and highest profit rates achievable under the new BPR?
Table 1 illustrates the range of initial contract profit rates achievable given the adjustments that are possible. The SSRO’s Annual qualifying defence contract statistics include a summary of actual agreed contract profit rates to date.
Table 1: Illustration of the four steps and the range of CPRs available before the impact of contractor performance
| Contract profit rate step | Value/Adjustment | |
|---|---|---|
| Unadjusted rate | 9.47% | |
| Capital servicing adjustment† | -1.23pp | |
| Step 1 | Baseline profit rate | 8.24% |
| Step 2 | Cost risk adjustment* | -2.06pp to +2.06pp |
| Step 3 | Incentive adjustment** | up to +2.00 pp |
| Step 4 | Capital servicing adjustment (CSA) † *** | Minimum: 0.0% Lower quartile: 0.4% Upper quartile: 1.5% Maximum: 8.3% |
| Illustrative minimum CPR, based on: -25% step 2, +0pp step 3 and +0.0pp step 4 |
6.18% |
| Illustrative low CPR, based on: -25% step 2, +0pp step 3 and +0.7pp step 4 |
6.58% |
| Illustrative high CPR, based on: +25% step 2, +2pp step 3 and +1.2pp step 4 |
13.80% |
| Illustrative maximum CPR, based on: +25% step 2, +2pp step 3 and +3.2pp step 4 |
20.60% |
The four-step process is set out in the SSRO’s publication Guidance on the Baseline Profit Rate and its Adjustment available on its website.[3]
† See Question 22 for an explanation of these two capital servicing adjustments
‘*’ An adjustment of between +/- 25 per cent of the BPR.
** A positive adjustment of up to two percentage points may apply to incentivise the achievement of enhanced performance.
*** Estimated using actual values for contracts priced in 2022/23. The actual adjustment may be higher, lower or negative. Source: SSRO (2022) Annual Qualifying Defence Contract Statistics: 2021/22
Depending on the contract pricing method, it is possible for a contractor to achieve a higher percentage profit than was initially agreed at contract signing by outperforming cost estimates, or to achieve a lower profit rate, or make a loss by underperforming. The final contract profit rate will therefore only be known once the contractor has fully delivered the contract.
It should be noted that the capital servicing adjustments in the table reflect actual rates agreed between the MOD and contractors. These may be less than adjustments that apply in the future due to this year’s increase in the capital servicing rates.
6. How does the baseline profit rate compare to the MOD suppliers’ weighted average costs of capital (WACC)?
The WACC describes the expected return required by investors on the money they put into a business. This is a different measure to the BPR which is based on return on cost of production (also known as a mark-up on cost, or a profit mark-up) and is not directly comparable to the WACC as a means of assessing profitability. The definition used by the SSRO is:
The relationship between investment in a company and cost incurred is complex. For an individual contract, a return on cost of production could be lower, higher or the same as the WACC and meet the requirements of investors. The required contract profit rate will depend on the individual circumstances of each contract and company, and there are few conclusions to be drawn from a direct comparison of the WACC to the BPR.
| Measure | Definition | Key similarities and differences |
|---|---|---|
| Profit margin or net margin | Profit (£) / Revenue (£) | Uses the same inputs as return on cost but is the return on revenue |
| Return on capital employed | Profit (£) / Capital Employed (£) | The return is measured against the assets that are used as part of operations |
| Return on invested capital | Profit (£) / Invested Capital (£) | The return is measured against the capital that has been invested in operations |
7. How do the profits of the companies who make up the BPR and the range of contract profit rates compare to those of the MOD’s main suppliers?
The table below shows the range of profits (5-year median of return on cost of production) exhibited by the top 20 listed companies by value of non-competitive spend in 2022/23, as reported by the MOD.* The 5-year median profit rate of the D&M and P&M comparator companies is included for reference. The rates shown for the suppliers are the median over the last five years to illustrate what might be considered typical for each.
| Company name | Return on cost of production: median FY2018 – FY2022* |
|---|---|
| CGI Inc. | 18.77% |
| Safran | 15.88% |
| BT Group PLC | 15.80% |
| Lockheed Martin Corp | 15.63% |
| Chemring Group PLC | 13.22% |
| Northrop Grumman Corporation | 12.42% |
| General Dynamics Corp | 12.23% |
| BAE Systems PLC | 11.42% |
| Qinetiq Group PLC | 10.74% |
| RTX Corp | 8.78% |
| Thales | 8.47% |
| Airbus SE | 8.17% |
| L3harris Technologies, Inc. | 8.16% |
| Saab AB | 8.05% |
| Leonardo S.P.A. | 5.66% |
| Serco Group PLC | 4.83% |
| Babcock International Group PLC | 1.49% |
| Boeing Company (The) | -4.76% |
| Rolls-Royce Holdings PLC | -4.95% |
| Palantir Technologies Inc. | -43.70% |
| Provide & Maintain median† | 9.90% |
|---|---|
| Develop & Make median† | 9.28% |
Source: Orbis and SSRO calculations
*Return on cost of production, unadjusted for capital servicing
†Median of the underlying rates, unadjusted for capital servicing, over the last 5 years
The top 20 companies’ 5-year median actual profit rates ranged from -43.7 per cent to 18.77 per cent. Note the actual profit rate of the company as a whole is also a product of any non-single source work it carries out. The illustrative range of available CPRs at time of agreement (see Q5 above) is 6.18 per cent to 20.60 per cent. The actual profit rate achieved on a contract may be higher than shown here by outperforming cost estimates, or a lower profit rate by underperforming. We would expect those who agreed the highest contract profit rates by taking on risk to achieve higher actual rates of profit where risk is managed successfully, and companies who agree the lower rates due to low risking to achieve similarly lower rates of actual profit.
*Ministry of Defence (2023) MOD trade, industry and contracts: 2023, MOD trade, industry and contracts: 2023 – GOV.UK (www.gov.uk)
8. How does the baseline profit rate affect small and medium sized enterprises?
The baseline profit rate and the four step contract profit rate process ensures that contractors can earn a fair and reasonable price and profit irrespective of company or contract size. The regime is designed offer protections to both contractor and the MOD from market power that might otherwise represent a challenge to smaller companies.
The SSRO is able to support smaller contractors who may be less familiar with the regime in a number of ways, including:
-
- Guidance published on our website
-
- A helpdesk service
-
- Contractor onboarding
Further information can be found on our website https://www.gov.uk/guidance/ssro-support
The methodology and the comparator groups
9. What is the basis of the SSRO’s methodology and how does this provide a fair and reasonable return to industry?
The SSRO is confident that the baseline profit rate is a fair and reasonable starting point for the contract profit rate calculation because it is set with reference to the actual profit rates of companies undertaking activities comparable to those that enable the performance of qualifying contracts. The methodology takes steps to remove loss-making companies and to only incorporate companies in comparable countries that perform comparable economic activities. The SSRO has been providing its rates assessment on this basis for eight years. MOD continue to successfully contract with suppliers within the range of rates our assessment provides for, demonstrating the suitability of our approach.
The comparable company search process follows the transfer pricing ‘arm’s length principle’ set out in the OECD transfer pricing guidelines. Transfer pricing is a concept which seeks to ensure that companies operating in a number of territories receive appropriate income and profit in each, as if each territory were operating at arm’s length from the other(s), as a third party would do. Transfer pricing is employed extensively by multinational enterprises and tax authorities globally, including the UK, and as such the guidelines, and their related expectations and practices, are widely known and understood and their practical implications have been explored.
For transparency, the SSRO publishes the list of criteria used to select comparable companies in the methodology and publishes the resulting list of comparable companies used in the comparator groups.
10. How representative are the activity type comparator groups of the UK defence industry?
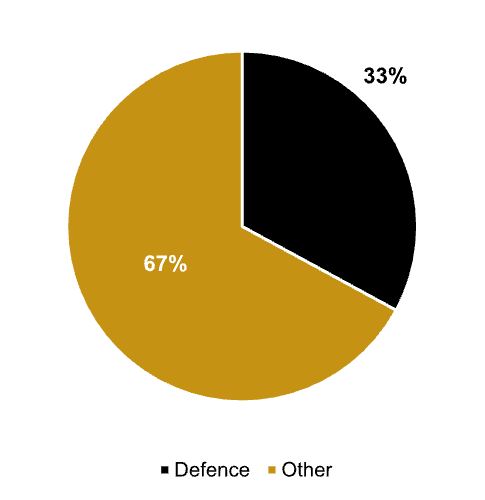
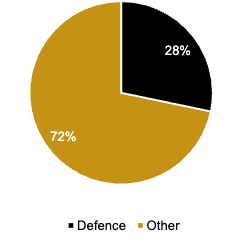
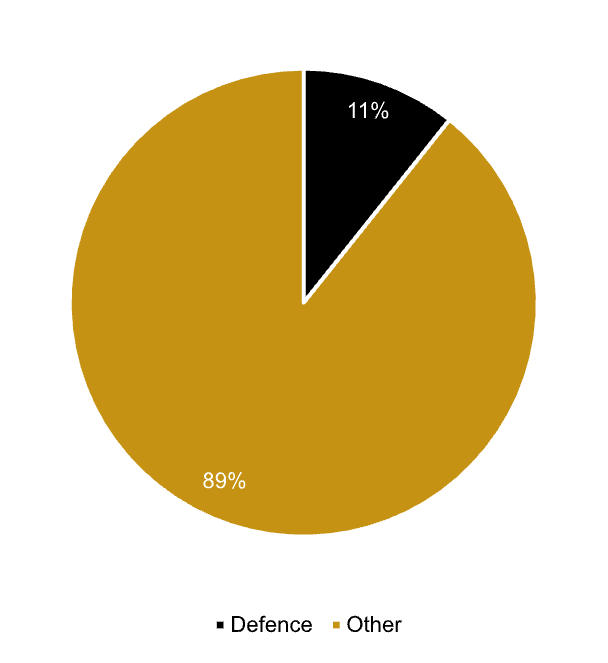
It is not the SSRO’s intention that the comparator groups contain only companies from the defence industry. To produce a robust, open-market benchmark, the BPR methodology includes companies operating in the defence sector as well as companies operating in non-defence sectors and outside of the single source regime. Companies that either have the words ‘defence’, ‘defense’, or ‘military’, or close variants of these words included in their activities description in the Orbis database account for 33 per cent of the companies used in the calculation of the composite rate for this year
The methodology identifies companies whose economic activities are of the type which contribute in whole or in part to the delivery of QDCs and QSCs. The result of the process is a robust comparator group that is relevant to the activities which contribute in whole or in part to the delivery of QDCs and QSCs. The range of contract profit rates achievable given this year’s BPR, give us confidence an appropriate group of companies has been selected (see questions 7 and 8).
11. Why does the SSRO recommend a composite rate based on the Develop and Make and Provide and Maintain activity types? Why are rates also published for Ancillary Services, Construction and Information Technology Services?
The composite rate is derived from two activity types: Develop and Make (D&M) and Provide and Maintain (P&M). Together, these types of work represent the vast majority of single-source procurement.
Given Ancillary Services, Construction and Information Technology Services account for a small minority of single-source contract spend they are not included in the composite rate as doing so would not be consistent with the principle of comparability. The approach of only including D&M and P&M has been taken for the 2024/25 recommendation is the same as for previous BPR recommendations.
The data on all five activity types is provided so that the Secretary of State can understand the basis on which the composite rate had been calculated and why it was considered appropriate.
12. What is the source of data for the SSRO’s assessment?
The Orbis database supplied by Bureau van Dijk, a Moody’s Analytics company, is used to search for comparable companies and as a source of financial information. The calculation uses publicly reported financial data that is prepared in accordance with accounting standards and aggregated in to the Orbis database. Data for the capital servicing adjustment is supplied by Bloomberg and the Bank of England. The SSRO publishes its methodology on its website containing detailed information on the data fields it uses.
13. Why have some companies left the comparator group and some joined?
In accordance with the SSRO’s methodology, the set of comparator companies was fully refreshed for last year’s assessment. This means that this year we carried forward the prior year’s group and reviewed all those companies to ensure they remained valid comparators.
To confirm that the companies undertake comparable activities, the SSRO has systematically reviewed each company that met the selection criteria. Assessments drew on detailed information from Orbis, on company websites, and other reputable information sources such as Bloomberg. This process was carried out independently of any consideration of the companies’ profit data. This review contained some subjective elements, but every effort is made to assess these aspects consistently.
Companies may also be added through the annual review of contractors with QDCs or QSCs (or their ultimate parent undertakings) and the latest data on the MOD’s spending with suppliers. Inclusion of additional companies is subject to the companies’ activities being comparable to the SSRO’s activity types and meeting relevant selection criteria such as turnover, independence and profitability. The overwhelming majority of the MOD’s main suppliers in recent years are included in the comparator groups.
Our process ensures that, as in previous years, companies are included or excluded based on the most up-to-date and robust evidence available to the SSRO.
14. What are the size criteria for companies to be included in the assessment?
Companies are included in the search if their financial data is of sufficient quality, determined by whether the company is of a size that would normally require an independent financial audit. This requires companies to have data that demonstrates they meet the following criteria for all of the last five years:
-
- an annual turnover of more than £10.2 million; and either one of the following:
-
- total assets worth more than £5.1 million; or
-
- 50 or more employees on average.
This threshold is set with reference to standardised thresholds used in the UK for determining if a company is small. The threshold in the methodology therefore ensures that there are no small companies in the comparator groups.
15. Why is the BPR set at the median average with loss-making companies excluded from the comparator groups?
The methodology is carefully calibrated to ensure that it represents a reasonable starting point for the application of the contract profit rate steps. The SSRO has published analysis which supports the exclusion of loss makers and using the median as an analytically robust approach.
The choice of average should reflect the specific characteristics of the data set and the median is a superior measure of central tendency compared to the mean or weighted mean given the skewed nature of the data set. The skew is due to the fact that:
-
- the SSRO excludes loss-makers but does not place an upper limit on the profit measure, resulting in a small number of companies with very high profit rates in the comparator group. The mean is unduly affected by the presence of such outliers; and
-
- the SSRO excludes small companies but does not place an upper limit on company size, resulting in a small number of very large companies in the comparator group. Using the weighted mean would result in the BPR being heavily influenced by this small group of companies resulting in volatility and uncertainty about the result.
The median is robust to these features of the data set and is the most appropriate choice of average.
The SSRO’s methodology seeks to measure a central markup on cost to be used in determining the price of a contract. Since it would not be normal to determine a price at a loss, measures of loss-making are not used in the baseline profit rate assessment. The exposure to loss-making on a qualifying contract is dealt with through the application of the price formula rather than the BPR (see question 7). Incorporating loss-making into the BPR would result in double counting and have resulted in a decrease in this year’s underlying rate of around 1.4pp.
16. What adjustments has the SSRO made to the data?
In line with the OECD guidelines, adjustments are made to the company data where they can be performed accurately and are expected to enhance reliability of the results. The SSRO’s calculation of the BPR is based on publicly-reported financial data that is prepared in accordance with accounting standards, is audited by companies’ external auditors, and which is subsequently aggregated by Bureau van Dijk.
As contemplated by the OECD transfer pricing guidelines*, the SSRO makes a capital servicing adjustment to take into account the different levels of fixed capital and working capital employed by the companies in the comparator group (see question 17). The SSRO’s view is that no further adjustment should be made.
The SSRO does not make any adjustments to the comparable company data to take into account costs that do not meet the requirement of being Allowable Costs. We do not consider it possible to reliably make an assessment of the costs of comparator companies, or to make corresponding adjustments to their other financial results (such as revenue) to reflect the company’s position as if the “disallowed” cost had not been incurred. The SSRO’s approach assumes the cost of production for each comparator company to be appropriate, attributable and reasonable in the circumstances in relation to the revenue each comparator company receives.
The SSRO does not make any adjustments to the comparable company data to take into account costs that relate to the purchase of one company by another. When a comparator company has subsidiaries the data we use is derived from the consolidated group financial statements. This data reflects that when an acquisition occurs the assets acquired and the revenues and costs associated with it become an integral part of the acquirer’s business and activities. Amortisation and impairment of acquired assets are a cost and are recognised in an accounting period in accordance with accounting standards. These costs are therefore treated as costs in both the baseline profit rate methodology and the SSRO’s Allowable Costs guidance. An uplift to the baseline profit rate for such costs would circumvent the requirements for contractors to demonstrate such costs were appropriate, attributable to the contract and reasonable in the circumstances.
*OECD Transfer Pricing Guidelines for Multinational Enterprises and Tax Administrations Chapter III para 3.48 (2017), OECD
17. Why does the SSRO make a capital servicing adjustment in calculating the BPR?
An adjustment is made by the SSRO in the calculation of the baseline profit rate to ensure the BPR is an appropriate baseline upon which to apply step 4.
Regulation 11(6) of the Single Source Contract Regulations 2011 and section 17(2) of Defence Reform Act 2014 provide for an adjustment to the contract profit rate (step 4) so as to ensure that the contractor receives an appropriate and reasonable return on capital employed for the purposes of performing the contract.
The return on capital employed is a ratio of the return on the contract (i.e. the total amount of contract profit) to the capital employed for the purpose of performing it (see question 21). This should not be confused with the return to capital employed which in this case is the component of profit which relates to the amount of step 4.
A contract profit rate therefore incorporates two adjustments that together take into account the different levels of fixed capital and working capital employed by the companies in the comparator group and the performance of a contract; one in the calculation of the BPR and a second adjustment agreed between the contracting parties at step 4 to reflect the circumstances of the QDC or QSC. The making of adjustments for capital is contemplated by the OECD transfer pricing guidelines.
The definitions of “capital employed” used for both adjustments are intended to be similar, to the extent possible. However, “capital employed” for the purposes of these adjustments is not intended to represent all capital employed by the comparator company or all capital employed in the performance of the contract, nor is step 4 the return on capital employed for the contract (see above). The process is one of normalising the comparator company data and then readjusting the BPR at step 4 to ensure that the overall effect of the CPR (taking account of steps 1-4) is that a contractor receives an appropriate and reasonable return on the fixed and working capital employed by the contractor for the purpose of enabling that contractor to perform the contract.
18. Is the SSRO consistent in its treatment of intangible assets in its calculation of the baseline profit rate?
Yes. The approach the SSRO takes ensures the aspects of the BPR calculation which relate to intangible assets are treated appropriately in respect of both cost and profit.
There are two circumstances where intangible assets might affect the calculation:
-
- amortisation costs of intangible assets; and
-
- the inclusion or otherwise of intangible assets in “capital employed” for the purpose of the capital servicing adjustment (see Q17).
The capital servicing adjustment in the calculation of the BPR does not remove any element of profit in respect of intangible assets because these are not included in the definition of “capital employed”. If an item is not included in the definition of capital employed used for the adjustment in the BPR calculation then the contract will receive an average return that is present within the baseline profit rate for that item, plus any additional amount as a result of the application of the other 4 steps.
Amortisation is the spreading out of the cost of acquiring intangible assets over a specific duration and is therefore rightly treated as a cost-related matter. Such costs may be Allowable Costs. Failing to recognise amortisation as a cost in the BPR calculation (for example by using EBITA as the profit level indicator) would result in contractors being reimbursed for these items at a flat rate, irrespective of whether they are incurred and in what amount. This would not be consistent with the requirements of Allowable Costs and would double-count the return on intangible assets already included in the contract profit rate.
19. Why does the SSRO not remove the effects of amortisation from the BPR?
The SSRO does not make any adjustments to the comparable company data to remove the cost of revenue generating assets that are amortised over time, for example costs that relate to the purchase of one company by another.
When a comparator company has subsidiaries the data we use is derived from the consolidated group financial statements. This data reflects that when an acquisition occurs the assets acquired and the revenues and costs associated with it become an integral part of the acquirer’s business and activities. Amortisation and impairment of acquired assets are a cost and are recognised in an accounting period in accordance with accounting standards. These costs are therefore treated as costs in both the baseline profit rate methodology and the SSRO’s Allowable Costs guidance. An uplift to the baseline profit rate for such costs would circumvent the requirements for contractors to demonstrate such costs were appropriate, attributable to the contract and reasonable in the circumstances.
20. Why does the SSRO not adjust for significant one-off events that affect the results of comparator companies?
We understand that companies can be affected by significant one-off events or that companies might be subject to significant one-off adjustments in a current year to reflect past events they were not previously aware of.
As explained in Question 16, we do not think we could reliably adjust for these items. However, the methodology is designed to mitigate the potential impact of these events, in particular:
-
- whilst some companies might have one-off costs others may have one-off income. The underlying rate is assessed using the financial information of a large pool of companies and so reflects all such one-off events;
-
- the averaging approaches taken, both the use of the median and the use of a rolling average, mitigate the impact that a particular one-off event in a particular company can have on the total result; and
-
- loss-making companies are excluded from the calculation to reflect the expectation of positive profit on estimated Allowable Costs in QDCs. This maintains consistency with the construct of the profit formula as a mark-up on estimated Allowable Costs and removes the possibility of a negative BPR being produced.
21. What is the impact on the assessment if a company restates their financial information and will the SSRO reassess a previous year’s rate if financial data has changed?
The financial information we draw from Orbis to calculate the underlying rate reflects the latest set of financial statements issued by a company. This means that if a company were to restate their prior financial results due to adopting a new accounting standard the information used to calculate the current year capital servicing adjustment would be those restated figures.
The SSRO calculates each underlying rate once and we do not re-assess previous years’ underlying rates. Calculating an underlying rate requires two full years of data and so it would not be possible for us to recalculate previous underlying rates because when companies restate financial information it is usually only presented in detail for the current and prior year.
If a material change in the underlying rate was to occur due to market-wide accounting change, or for any other reason, the three-year averaging helps mitigate short-term volatility in the baseline profit rate assessment and incorporates changes in a phased and predictable way. We consider this to be beneficial to contractors and the MOD. Restating past underlying rates would undermine this process. The definitions of “capital employed” used for both adjustments are intended to be similar, to the extent possible. However, “capital employed” for the purposes of these adjustments is not intended to represent all capital employed by the comparator company or all capital employed in the performance of the contract, nor is step 4 the return on capital employed for the contract (see above). The process is one of normalising the comparator company data and then readjusting the BPR at step 4 to ensure that the overall effect on the CPR (taking account of steps 1-4) is that a contractor receives an appropriate and reasonable return on the fixed and working capital employed by that contractor for the purpose of enabling the contractor to perform the contract.
Capital servicing rates
22. How does the SSRO calculate the capital servicing adjustments and how are these used in the calculation of the baseline profit rate?
Each year the SSRO calculates the following three capital servicing rates based on averages of interest rate data published by Bloomberg or the Bank of England:
-
- Fixed capital
-
- Positive working capital
-
- Negative working capital
The profit rate of each comparator company is adjusted in proportion to the ratio of fixed and working capital employed to costs of production, a measure of the capital intensity of the company. A corresponding adjustment is made in the pricing of individual contracts by an adjustment at step 4 of the contract profit rate to reflect the capital intensity of the contract (see question 20).
This process ensures that the contract profit rate reflects an appropriate and reasonable return on the fixed and working capital employed by the contractor for the purposes of enabling the contractor to perform the contract.
23. Why are the capital servicing rates not set as high as headline interest rates such as those set by the Bank of England?
The capital servicing rates for this year are:
-
- Fixed capital 3.26%
-
- Positive working capital 3.10%
-
- Negative working capital 1.61%
These rates, calculated based on time period averages of market interest rates, provide an allowance for servicing debt used to finance the operations of a company to deliver QSC and QSC and generate profits. Most commonly, the cost of borrowing (e.g. an interest rate on a loan) tends to reflect the economic conditions when borrowing takes place, rather than when the debt is repaid. In the case of long term borrowing this means current capital servicing cost relates to debt accumulated from many years back. This results in capital servicing rates reflecting the period of low interest rates which precedes the more recent increase and are therefore lower than current headline rates set by the Bank of England and other central banks.
This process also means that the capital serving rate move more slowly than changes in headline interest rates, as old borrowing gradually expires and new borrowing is entered into at current market rates. Conversely changes in short term borrowing is more quickly reflected in the working capital servicing rates, which can be seen in this year’s relatively larger increases compared to the fixed capital servicing rate.
SSRO Funding Adjustment
24. What has happened to the SSRO funding adjustment?
From the 01 April 2024 it is no longer a requirement to make a deduction for the SSRO funding adjustment when calculating the contract profit rate. The SSRO has updated its guidance accordingly.
Schedule 10 of the Procurement Act will remove the SSRO funding adjustment from the contract profit rate process and, consequently, the requirement for the SSRO to assess it beyond 2024/25. These legislative changes had not come into force as at 31 January 2024 and therefore the SSRO was still required to provide its assessment of the appropriate rate, even though it was not expected to come into force.
Under the Defence Reform Act 2014, the SSRO must provide the Secretary of State with its assessment of the appropriate rates used to determine the contract profit rate for pricing qualifying defence contracts and qualifying sub-contracts. For further information on the methodology used to calculate these rates please see the Single source baseline profit rate and capital servicing rates methodology.
Baseline Profit Rate
The baseline profit rate is step 1 of the four-step process for determining the contract profit rate for a qualifying defence contract.
From 01 April 2024, this replaces the previous six-step process.
| 2020/21 | 2021/22 | 2022/23** | 2023/24 | 2024/25 | |
|---|---|---|---|---|---|
| Underlying rate (unadjusted for capital servicing)Note1 | 9.80% | 9.59% | 8.24% | 9.50% | 9.31% |
| Capital servicing adjustment | -1.57% | -1.40% | -0.89% | -1.06% | -1.22% |
| Underlying rate | 8.23% | 8.19% | 7.35% | 8.44% | 8.09% |
| Baseline profit rate recommended by the SSRO; | |||||
| rolling average of the underlying rate* | 8.22% | 8.31% | 8.07% | 8.29% | 8.24% |
Note 1: The capital servicing adjustment accounts, at an aggregate level, for different levels of capital employed across the companies in the index and so sets a baseline upon which step 4 (previously step 6) of the contract profit rate applies.
Median capital servicing adjusted return on cost of production
Data sources
For further information on the data selection approach please see section 7 of the Single source baseline profit rate and capital servicing rates methodology. A company update search of the Orbis database was carried out on 1 November 2023 on data update number 342001 using software version 342. The financial data for the calculation was extracted from Orbis at the same time.
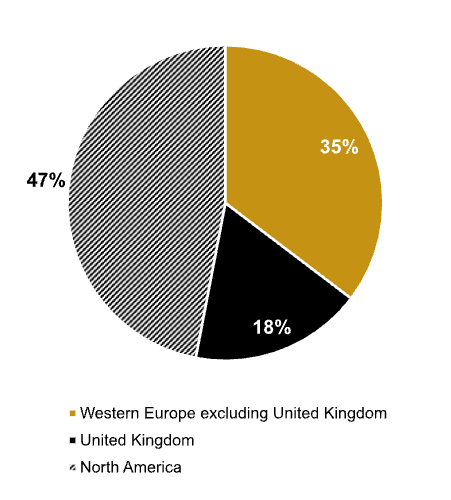
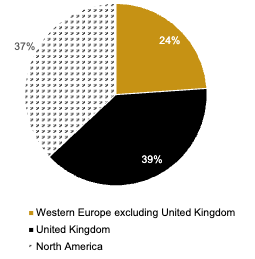
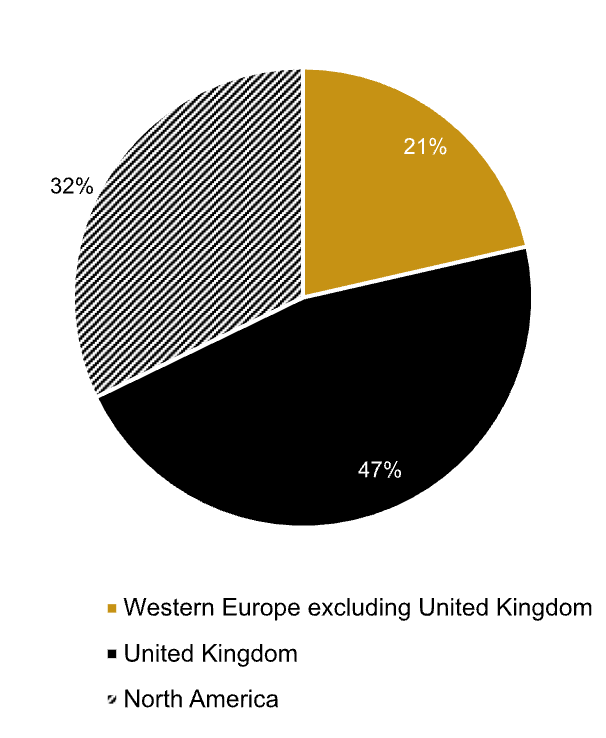
Proportion of companies by country
Proportion of companies with defence keyword
Supplementary statistics
| Number of companies | 300 |
|---|---|
| of which profit making | 249 |
| Aggregate turnover (£billions) | £1,221 |
| Total capital employed (CE) (£billions) | £325 |
| Average company CP:CE ratio | 3.35 |
Source: Orbis (Cash figures shown in rounded GBP Billions)
Names of companies in the index
| Aaon INC |
| AAR Corp |
| AB Transitio * |
| AB Volvo |
| Accuracy International Limited |
| Advanced Mechanical and Optical Systems * |
| Aerovironment, Inc. * |
| Aguirre Maquinaria Agricola SL. |
| AIR Industries Group * |
| Airbus SE |
| Airtanker Holdings Limited |
| Airtanker Services Limited |
| Alamo Group INC |
| Alimak Group AB |
| Allient INC |
| Allison Transmission Holdings, Inc. |
| Alltruck PLC |
| Alstom S.A * |
| American Axle & Manufacturing Holdings INC |
| Ametek INC |
| Amtech Systems INC |
| Analog Devices INC |
| Andritz AG |
| Applus Services, S.A. |
| Aptiv PLC |
| Archrock, Inc. |
| Ashtead Group PLC |
| Astec Industries INC |
| Astronics Corporation * |
| Astronova, Inc. |
| Athader SL |
| Atlas Copco AB |
| ATS Corporation |
| Aumann AG * |
| Autoliv, Inc. |
| Avant Tecno Oy |
| Avon Protection PLC * (J) |
| Axcelis Technologies INC |
| Axon Enterprise, Inc. |
| Azkoyen SA |
| Babcock & Wilcox Enterprises, Inc. * |
| Babcock International Group PLC |
| BAE Systems PLC |
| Bailey Trailers Limited |
| Barco NV |
| Barnes Group INC |
| Binder + Co AG |
| Bittium OYJ * |
| BK Technologies Corporation * |
| Blue Bird Corporation * |
| BMI Trailers Limited |
| Boeing Company (The) * |
| Broadwind, Inc. * |
| Bruker Corporation |
| Brunvoll Holding AS |
| BWX Technologies Inc. |
| Caci International INC |
| Cactus, Inc. |
| CAE INC |
| Carver Group Limited |
| Castledon LTD |
| Caterpillar INC |
| Ceco Environmental Corp. |
| CGG |
| Chart Industries INC |
| Chemring Group PLC |
| Circor International INC (J) |
| CMZ Machine Tool Manufacturer Sociedad Limitada. |
| CNH Industrial N.V |
| Cognex Corp |
| Coherent Corp |
| Cohort PLC |
| Colosio S.R.L. |
| Columbus Mckinnon Corp |
| Commercial Vehicle Group, Inc. |
| Comtech Telecommunications Corp * |
| Construcciones Y Auxiliar de Ferrocarriles, S.A. |
| Continental AG |
| Cowles Holdings Limited |
| CPI Aerostructures INC |
| CTA International SAS |
| CTT Systems AB |
| Cummins Inc. |
| Curtiss Wright Corp |
| Cuypers Vorkliften |
| D.R.A. LTD |
| Data I/O Corp * |
| David Ritchie (Implements) Limited |
| Dawsongroup PLC |
| de Lorenzo S.P.A. |
| Deere & CO |
| Deutz AG |
| Douglas Dynamics, Inc. |
| Dril-Quip INC * |
| Ducommun INC |
| Duerr AG |
| Electromecanica Naval E Industrial SA * |
| Energy Recovery, Inc. |
| Enerpac Tool Group Corp |
| Espey MFG and Electronics Corp |
| EVS Broadcast Equipment SA |
| Fabricacion de Elevadores SL * |
| Fabrications Mecaniques de l’Atlantique * |
| Faro Technologies INC * |
| Federal Signal Corp |
| Filtronic PLC |
| Finning International INC |
| Fisher (James) & Sons PLC |
| Flowserve Corp |
| Fortress Transportation and Infrastructure Investors LLC * |
| Forvia SE |
| Frigoveneta S.P.A. |
| Frumecar SL |
| G M Treble Holdings Limited |
| G.H.B. (Holding) Limited |
| Gama Aviation PLC * |
| Gatx Corp |
| Genasys Inc. * |
| Gencor Industries, Inc. |
| General de Alquiler de Maquinaria, S.A. |
| General Dynamics Corp |
| General Electric Company |
| Gentex Corp |
| Gesellschaft fuer Oeltechnik mit beschraenkter Haftung |
| Gorman-Rupp Company (The) |
| Graco INC |
| Graham Corp |
| Greenbrier Companies, Inc. (The) |
| Guzzetti S.P.A. * |
| H&E Equipment Services, Inc. |
| Heico Corp |
| Heidelberger Druckmaschinen AG |
| Heroux-Devtek INC |
| Hexcel Corp |
| Hiden Instruments Limited |
| Honeywell International INC |
| Huntington Ingalls Industries, Inc. |
| Idex Corp |
| IMI PLC |
| Indra Sistemas S.A. |
| Industrias Montanesas Electricas Mecanicas SL |
| Inficon Holding AG |
| Ingersoll Rand Inc. |
| Innovative Solutions & Support INC |
| Interroll Holding AG |
| IPG Photonics Corporation |
| Istobal SA |
| Italcab S.P.A. * |
| Jacobs Solutions Inc. |
| John Bean Technologies Corp |
| John Wood Group PLC * (J) |
| Johnson Controls International PLC (J) |
| Jost Werke AG |
| Judges Scientific PLC |
| Kadant INC |
| Kaman Corp * |
| Katsa Oy |
| Kbr, Inc. |
| Kesla OYJ * |
| Keysight Technologies, Inc. |
| Klingelnberg AG |
| Koenig UND Bauer AG |
| Komax Holding AG |
| Konecranes OYJ |
| Kratos Defense and Security Solutins INC * |
| L3harris Technologies, Inc. |
| LAM Research Corp |
| Leonardo S.P.A. |
| Lillbacka Powerco Oy * |
| Linamar Corporation |
| Lockheed Martin Corp |
| Lombardi Converting Machinery S.P.A. * |
| Magna International INC |
| Manitex International, Inc. |
| Manitou BF |
| Manitowoc Company, Inc. (The) * |
| Marel HF |
| Mariani S.R.L. |
| Maschinenfabrik Berthold Hermle AG |
| MAX Automation SE |
| Mcgrath Rentcorp |
| Mecapack |
| Mercury Systems INC |
| Mikron Holding AG |
| Miller Industries INC |
| MKS Instruments INC |
| Modine Manufacturing CO |
| Moog INC |
| Motorola Solutions, Inc. |
| Mpac Group PLC * |
| MS International PLC |
| MTU Aero Engines AG |
| Muehlhan AG |
| N3 Engine Overhaul Services GmbH & Co. KG |
| Nammo AS |
| Natural GAS Services Group, Inc. * |
| NC Engineering (Hamiltonsbawn) Limited * |
| NFI Group Inc. * |
| NG Bailey Group Limited * |
| Nordson Corp |
| Northrop Grumman Corporation |
| NOV INC |
| Novanta INC |
| Nuova Idropress – Societa’ PER Azioni IN Forma Abbreviata NIP S.P.A. |
| NVE Corporation |
| Officina Bocedi SRL |
| Officina Meccanica F.Lli Tabarelli S.P.A. |
| Onto Innovation Inc. |
| Oshkosh Corporation |
| Oxford Instruments PLC |
| Oy El-Ho Ab |
| Paccar INC |
| Park Aerospace Corp. |
| Paul Mueller Company |
| Petards Group PLC |
| Pietro Fiorentini S.P.A. |
| Ponsse OYJ |
| Portsmouth Aviation Holdings Limited |
| Powell Industries INC |
| Presses et Cisailles Lefort * |
| PSM Projekt System & Management Gmbh |
| PVA Tepla AG |
| Qinetiq Group PLC |
| Raute OYJ * |
| Redde Northgate PLC |
| Renew Holdings PLC |
| Renishaw PLC |
| REV Group, Inc. |
| Rheinmetall AG |
| Ricardo PLC |
| Robson Handling Technology Limited * |
| Rockwell Automation, Inc. |
| Rohde & Schwarz GmbH & Co. Kommanditgesellschaft |
| Rolls-Royce Holdings PLC |
| Ropsley Limited |
| RTX Corp |
| RWG (Repair & Overhauls) Limited |
| Ryder System INC |
| Saab AB |
| Saalasti Oy |
| Safran |
| Salmoiraghi S.P.A. |
| Saltire Energy Limited |
| Sawo Holding A/S |
| SC Group-Global Limited |
| Schlatter Industries AG |
| Schmitt – Elevadores, LDA |
| Servotronics INC * |
| Servovalve S.P.A. * |
| Siemens AG |
| Skako A/S |
| Smiths Group PLC |
| Snc-Lavalin Group INC (J) |
| Speedy Hire PLC |
| Spirit Aerosystems Holdings, Inc. * |
| Star Refrigeration Limited * |
| Systemair AB |
| TAI Milano S.P.A. |
| Taylor Devices INC |
| Teagle Holdings Limited * |
| Technipfmc PLC |
| Teledyne Technologies Incorporated |
| Tennant CO |
| Teradyne INC |
| Terex Corp |
| Tesmec SPA |
| Textron INC |
| Thales |
| THE Shyft Group, Inc. |
| Thwaites Limited |
| Thyssenkrupp AG |
| Tiber Pack S.P.A. |
| Tomra Systems ASA |
| Tornado Global Hydrovacs Ltd. |
| Toromont Industries LTD |
| Trakm8 Holdings PLC * |
| Transdigm Group Incorporated (J) |
| Trinity Industries INC |
| Triumph Group INC |
| Tronrud Engineering AS |
| TTM Technologies INC |
| Twin Disc INC |
| United Rentals, Inc. |
| Vaisala OYJ |
| Veeco Instruments INC |
| Vegsund Slip Holding AS |
| Vicinity Motor Corp. * |
| VSE Corp |
| Wabash National Corp |
| Wacker Neuson SE |
| Wartsila OYJ * (J) |
| Washtec AG |
| Werent S.R.L. |
| Westinghouse AIR Brake Technologies Corp |
| Williams Shipping Holdings Limited |
| Willis Lease Finance Corp |
| Willis Mitsui & CO Engine Support Limited * |
| Wilton Universal Group Limited * |
| Woodward, Inc. |
| Xylem Inc. |
‘*’ Indicates that the company is a loss-maker in the year.
(J) indicates a company that was not in either the D&M or the P&M activity group last year, but has been added this year.
Capital servicing rates
The capital servicing rates are used as part of the Step 4 Capital Servicing Adjustment (CSA) of the four-step process for determining the contract profit rate for a qualifying defence contract. A corresponding adjustment accounts, at an aggregate level, for different levels of capital employed across the companies in the index and so sets a baseline upon which Step 4 of the contract profit rate applies.
The capital servicing rates are calculated from indices of sterling denominated corporate bonds or fixed maturity deposits. The rates are rolling averages of the underlying rates.
| 2020/21 | 2021/22 | 2022/23* | 2023/24 | 2024/25 | |
|---|---|---|---|---|---|
| Fixed capital servicing rate | 3.66% | 3.27% | 2.87% | 2.90% | 3.26% |
| Positive working capital servicing rate | 1.22% | 1.33% | 1.09% | 1.67% | 3.10% |
| Negative working capital servicing rate | 0.61% | 0.65% | 0.51% | 0.51% | 1.61% |
‘*’ Shown are the 2022/23 rates recommended by the SSRO. The Secretary of State determined the BPR for 2022/23 as an average of the composite underlying rates calculated by the SSRO for the three years prior to 2021 (8.50%, 8.23%, and 8.19%), keeping the BPR at 8.31 per cent. This fixed the capital servicing rates the same as for 2021/22.
Data sources
For further information on the data selection approach please see section 13 of the Single source baseline profit rate and capital servicing rates methodology.
| Rate | Description | |
|---|---|---|
| Fixed capital servicing rate | Seven-year average of ’15-year BBB GBP’ bonds* | C40515Y INDEX |
| Positive working capital servicing rate | Three-year average of ‘1-year BBB GBP’ bonds | C4051Y INDEX |
| Negative working capital servicing rate | Three-year average of Monthly average of UK resident monetary financial institutions’ (excl. Central Bank) sterling weighted average interest rate – time deposits with fixed original maturity <=1 year from private non-financial corporations (in percent) not seasonally adjusted | CFMBI32 |
Sources: Bloomberg and Bank of England ‘*‘Note: Prior to 31 December 2014 the underlying rate is calculated using the Review Board’s methodology, adding 0.5pp to estimate a BBB- yield.
Trends in capital servicing rates
Government owned contractor rate
The Government owned contractor rate is a baseline profit rate that may be applied to qualifying contracts in place of the baseline profit rate set out on page 1.
The government owned contractor rate must only apply to qualifying defence contracts where:
-
- the contract is between Secretary of State and a company incorporated under the Companies Act that is wholly owned by the UK Government; and
-
- both parties to the contract agree that it should apply.
Calculation of Government owned contractor rate
The government owned contractor rate was set at a level that is opposite to the application of the SSRO funding adjustment. Prior to 2024/25 this approach delivers a contract profit rate of zero if steps 2, 5 and 6 are determined to be zero.
For 2024/25 onwards, Schedule 10 of the Procurement Act 2023 has come into force removing the SSRO funding adjustment from the previous six-step process. The approach remains the same for the four-step process brought into force by Schedule 10, such that it delivers a contract profit rate of zero if steps 2, 3 and 4 are determined to be zero.
| 2020/21 | 2021/22 | 2022/23 | 2023/24 | 2024/25 | |
|---|---|---|---|---|---|
| Government owned contractor rate | 0.057%* | 0.046% | 0.038% | 0.00% |
Note: The Government-owned contractor rate was first introduced for 2021/22.
‘*’ The SSRO did not recommend a government owned contractor rate for 2021/22 and the rate was assessed by the Secretary of State. The reason for doing so is set out in the London Gazette: https://www.thegazette.co.uk/notice/3760612
‘*’ A four-year average was used for 2022/23; a three-year average for pre-2022/23 and a three-year average (excluding the 2022/23 underlying rate) for 2023/24 and 2024/25.
The pre-2020/21 underlying rates used for the three-year average were: 2018/19: 7.94%, 2019/20: 8.50%
** Shown are the 2022/23 rates recommended by the SSRO. The Secretary of State determined the BPR for 2022/23 as an average of the composite underlying rates calculated by the SSRO for the three years prior to 2021 (8.50%, 8.23%, and 8.19%), keeping the BPR at 8.31 per cent.
-
- Note: The capital servicing adjustment accounts, at an aggregate level, for different levels of capital employed across the companies in the index and so sets a baseline upon which step 4 (previously step 6) of the contract profit rate applies.
Under the Defence Reform Act 2014, the SSRO must provide the Secretary of State with its assessment of the appropriate rates used to determine the contract profit rate for pricing qualifying defence contracts and qualifying sub-contracts. Part of the methodology is the categorisation of comparator companies into five activity types.
- Develop and Make
- Provide and Maintain
- Ancillary Services
- Construction
- Information Technology Services
The results of these groups are separately analysed and this fact sheet describes the Develop and Make group results.
The baseline profit rate combines results from “Develop and Make” and “Provide and Maintain”, as set out in the Recommendation Factsheet. For further information on the methodology used to calculate these rates please see the Single Source baseline profit rate, capital servicing rates and funding adjustment methodology.
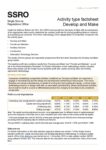
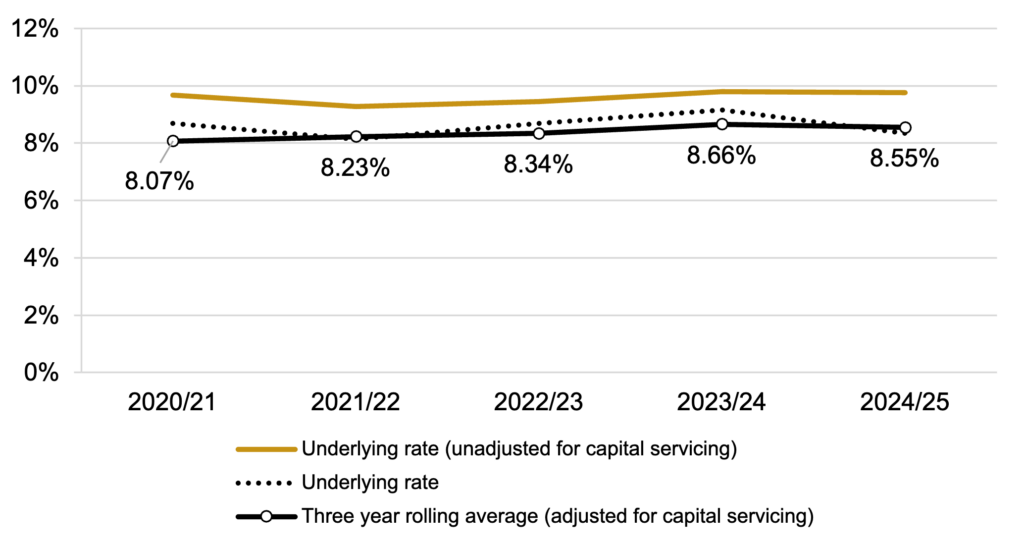
Develop and make
Profit on cost of production
| 2020/21 | 2021/22 | 2022/23 | 2023/24 | 2024/25 | |
|---|---|---|---|---|---|
| Underlying rate (unadjusted for capital servicing) | 9.67% | 9.28% | 9.45% | 9.80% | 9.76% |
| Capital servicing adjustment | -0.98% | -1.15% | -0.77% | -0.64% | -1.41% |
| Underlying rate | 8.69% | 8.13% | 8.68% | 9.16% | 8.35% |
| Rolling average* | 8.07% | 8.23% | 8.34% | 8.66% | 8.55% |
Note: The capital servicing adjustment accounts, at an aggregate level, for different levels of capital employed across the companies in the index and so sets a baseline upon which step 6 of the contract profit rate applies.
‘*’ A four-year average was used for 2022/23; a three-year average for pre-2022/23 and a three-year average (excluding 2022/23 underlying rate) for 2023/24 and 2024/25.
The pre-2020/21 underlying rates used for the three-year average were: 2018/19: 7.67% and 2019/20: 7.86%
Data sources
For further information on the data selection approach please see section 7 of the Single Source baseline profit rate, capital servicing rates and funding adjustment methodology. A company update search of the Orbis database[1] was carried out on 1 November 2023 on data update number 342001 using software version 342. The financial data for the calculation was extracted from Orbis at the same time.
Median capital servicing adjusted return on cost of production
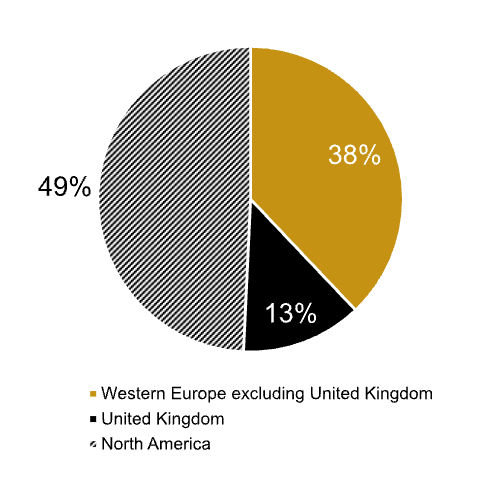
Proportion of Companies by country
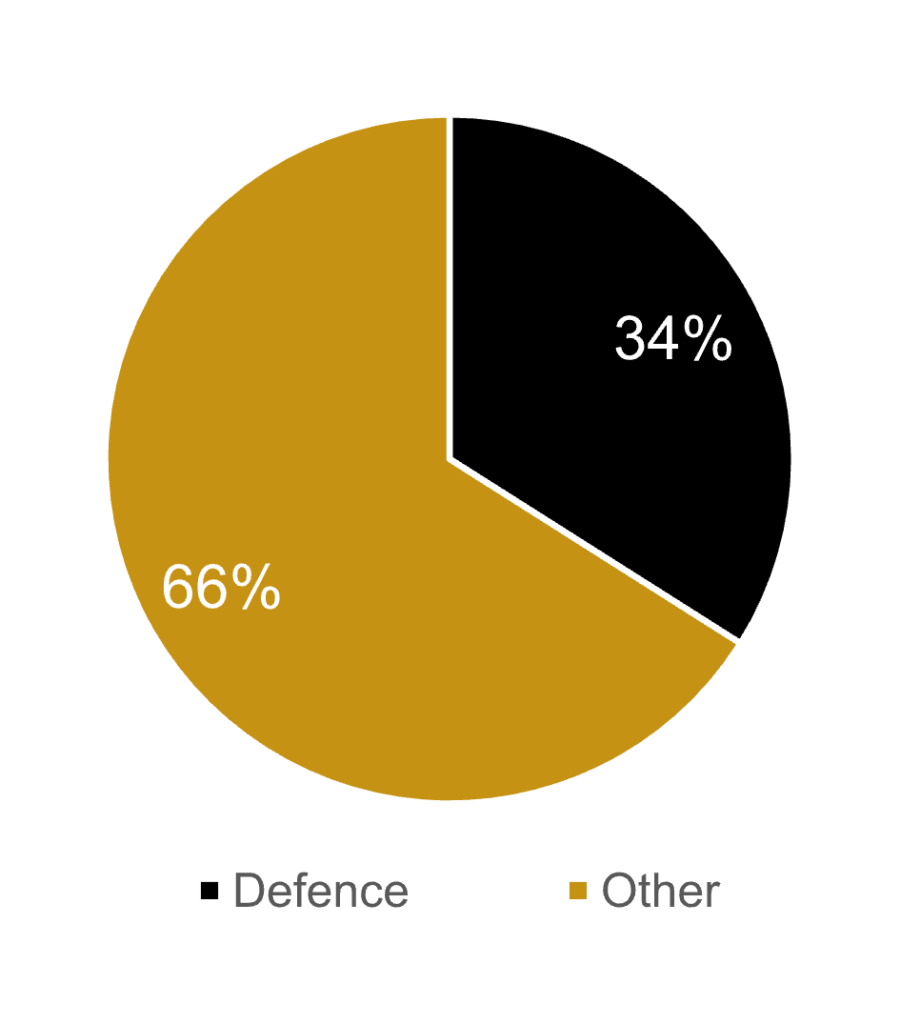
Proportion of companies with defence keyword
Supplementary statistics
| Number of companies | 247 |
| of which profit making | 203 |
| Aggregate turnover (£billions) | £1,096 |
| Total capital employed (CE) (£billions) | £266 |
| Average company CP:CE ratio | 3.68 |
Source: Orbis (Cash figures shown in rounded GBP Billions)
Names of companies in the index
| Aaon INC |
| AB Volvo |
| Accuracy International Limited |
| Advanced Mechanical and Optical Systems * |
| Aerovironment, Inc. * |
| Aguirre Maquinaria Agricola SL. |
| AIR Industries Group * |
| Airbus SE |
| Alamo Group INC |
| Alimak Group AB |
| Allient INC |
| Allison Transmission Holdings, Inc. |
| Alstom S.A * |
| American Axle & Manufacturing Hldngs INC |
| Ametek INC |
| Amtech Systems INC |
| Analog Devices INC |
| Andritz AG |
| Aptiv PLC |
| Astec Industries INC |
| Astronics Corporation * |
| Astronova, Inc. |
| Athader SL |
| Atlas Copco AB |
| ATS Corporation |
| Aumann AG * |
| Autoliv, Inc. |
| Avant Tecno Oy |
| Avon Protection PLC * (J) |
| Axcelis Technologies INC |
| Axon Enterprise, Inc. |
| Azkoyen SA |
| BAE Systems PLC |
| Bailey Trailers Limited |
| Barco NV |
| Barnes Group INC |
| Binder + Co AG |
| Bittium OYJ * |
| BK Technologies Corporation * |
| Blue Bird Corporation * |
| BMI Trailers Limited |
| Boeing Company (The) * |
| Broadwind, Inc. * |
| Bruker Corporation |
| Brunvoll Holding AS |
| BWX Technologies Inc. |
| Caci International INC |
| Cactus, Inc. |
| Carver Group Limited |
| Castledon LTD |
| Caterpillar INC |
| Ceco Environmental Corp. |
| CGG |
| Chart Industries INC |
| Chemring Group PLC |
| Circor International INC (J) |
| CMZ Machine Tool Manufacturer Sociedad Limitada. |
| CNH Industrial N.V |
| Cognex Corp |
| Coherent Corp |
| Cohort PLC |
| Colosio S.R.L. |
| Columbus Mckinnon Corp |
| Commercial Vehicle Group, Inc. |
| Comtech Telecommunications Corp * |
| Construcciones Y Auxiliar de Ferrocarriles, S.A. |
| Continental AG |
| CPI Aerostructures INC |
| CTA International SAS |
| CTT Systems AB |
| Cummins Inc. |
| Curtiss Wright Corp |
| D.R.A. LTD |
| Data I/O Corp * |
| David Ritchie (Implements) Limited |
| de Lorenzo S.P.A. |
| Deere & CO |
| Deutz AG |
| Douglas Dynamics, Inc. |
| Dril-Quip INC * |
| Ducommun INC |
| Duerr AG |
| Electromecanica Naval E Industrial SA * |
| Energy Recovery, Inc. |
| Enerpac Tool Group Corp |
| Espey MFG and Electronics Corp |
| EVS Broadcast Equipment SA |
| Fabricacion de Elevadores SL * |
| Fabrications Mecaniques de l’Atlantique * |
| Faro Technologies INC * |
| Federal Signal Corp |
| Filtronic PLC |
| Forvia SE |
| Frigoveneta S.P.A. |
| Frumecar SL |
| G.H.B. (Holding) Limited |
| Genasys Inc. * |
| Gencor Industries, Inc. |
| General Dynamics Corp |
| General Electric Company |
| Gentex Corp |
| Gesellschaft fuer Oeltechnik mit beschraenkter Haftung |
| Gorman-Rupp Company (The) |
| Graco INC |
| Graham Corp |
| Greenbrier Companies, Inc. (The) |
| Guzzetti S.P.A. * |
| Heico Corp |
| Heidelberger Druckmaschinen AG |
| Heroux-Devtek INC |
| Hexcel Corp |
| Hiden Instruments Limited |
| Honeywell International INC |
| Huntington Ingalls Industries, Inc. |
| Idex Corp |
| IMI PLC |
| Industrias Montanesas Electricas Mecanicas SL |
| Inficon Holding AG |
| Ingersoll Rand Inc. |
| Innovative Solutions & Support INC |
| Interroll Holding AG |
| IPG Photonics Corporation |
| Istobal SA |
| Italcab S.P.A. * |
| John Bean Technologies Corp |
| Jost Werke AG |
| Judges Scientific PLC |
| Kadant INC |
| Kaman Corp * |
| Katsa Oy |
| Kesla OYJ * |
| Keysight Technologies, Inc. |
| Klingelnberg AG |
| Koenig UND Bauer AG |
| Komax Holding AG |
| Konecranes OYJ |
| Kratos Defense and Security Solutins INC * |
| L3harris Technologies, Inc. |
| LAM Research Corp |
| Leonardo S.P.A. |
| Lillbacka Powerco Oy * |
| Linamar Corporation |
| Lockheed Martin Corp |
| Lombardi Converting Machinery S.P.A. * |
| Magna International INC |
| Manitex International, Inc. |
| Manitou BF |
| Manitowoc Company, Inc. (The) * |
| Marel HF |
| Mariani S.R.L. |
| Maschinenfabrik Berthold Hermle AG |
| MAX Automation SE |
| Mecapack |
| Mercury Systems INC |
| Mikron Holding AG |
| Miller Industries INC |
| MKS Instruments INC |
| Modine Manufacturing CO |
| Moog INC |
| Motorola Solutions, Inc. |
| Mpac Group PLC * |
| MS International PLC |
| Nammo AS |
| NC Engineering (Hamiltonsbawn) Limited * |
| NFI Group Inc. * |
| NG Bailey Group Limited * |
| Nordson Corp |
| Northrop Grumman Corporation |
| NOV INC |
| Novanta INC |
| Nuova Idropress – Societa’ PER Azioni IN Forma Abbreviata NIP S.P.A. |
| NVE Corporation |
| Officina Bocedi SRL |
| Officina Meccanica F.Lli Tabarelli S.P.A. |
| Onto Innovation Inc. |
| Oshkosh Corporation |
| Oxford Instruments PLC |
| Oy El-Ho Ab |
| Paccar INC |
| Park Aerospace Corp. |
| Paul Mueller Company |
| Petards Group PLC |
| Pietro Fiorentini S.P.A. |
| Ponsse OYJ |
| Portsmouth Aviation Holdings Limited |
| Powell Industries INC |
| Presses et Cisailles Lefort * |
| PSM Projekt System & Management Gmbh |
| PVA Tepla AG |
| Qinetiq Group PLC |
| Raute OYJ * |
| Renishaw PLC |
| REV Group, Inc. |
| Rheinmetall AG |
| Robson Handling Technology Limited * |
| Rockwell Automation, Inc. |
| Rohde & Schwarz GmbH & Co. Kommanditgesellschaft |
| Rolls-Royce Holdings PLC |
| RTX Corp |
| Saab AB |
| Saalasti Oy |
| Safran |
| Salmoiraghi S.P.A. |
| SC Group-Global Limited |
| Schlatter Industries AG |
| Schmitt – Elevadores, LDA |
| Servotronics INC * |
| Servovalve S.P.A. * |
| Siemens AG |
| Skako A/S |
| Smiths Group PLC |
| Spirit Aerosystems Holdings, Inc. * |
| Star Refrigeration Limited * |
| Systemair AB |
| TAI Milano S.P.A. |
| Taylor Devices INC |
| Teagle Holdings Limited * |
| Teledyne Technologies Incorporated |
| Tennant CO |
| Teradyne INC |
| Terex Corp |
| Tesmec SPA |
| Textron INC |
| Thales |
| THE Shyft Group, Inc. |
| Thwaites Limited |
| Thyssenkrupp AG |
| Tiber Pack S.P.A. |
| Tomra Systems ASA |
| Tornado Global Hydrovacs Ltd. |
| Trakm8 Holdings PLC * |
| Transdigm Group Incorporated (J) |
| Trinity Industries INC |
| Triumph Group INC |
| Tronrud Engineering AS |
| TTM Technologies INC |
| Twin Disc INC |
| Vaisala OYJ |
| Veeco Instruments INC |
| Vicinity Motor Corp. * |
| Wabash National Corp |
| Wacker Neuson SE |
| Wartsila OYJ * (J) |
| Washtec AG |
| Wilton Universal Group Limited * |
| Woodward, Inc. |
| Xylem Inc. |
‘*’ Indicates that the company is a loss-maker in the year.
(J) indicates a company whi
Under the Defence Reform Act 2014, the SSRO must provide the Secretary of State with its assessment of the appropriate rates used to determine the contract profit rate for pricing qualifying defence contracts and qualifying sub-contracts. Part of the methodology is the categorisation of comparator companies into five activity types.
- Develop and Make
- Provide and Maintain
- Ancillary Services
- Construction
- Information Technology Services
The results of these groups are separately analysed and this fact sheet describes the Provide and Maintain group results.
The baseline profit rate combines results from “Develop and Make” and “Provide and Maintain”, as set out in the Recommendation Factsheet. For further information on the methodology used to calculate these rates please see the Single Source baseline profit rate, capital servicing rates and funding adjustment methodology.
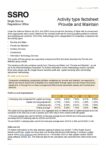
Provide and maintain
Profit on cost of production
| 2020/21 | 2021/22 | 2022/23 | 2023/24 | 2024/25 | |
|---|---|---|---|---|---|
| Underlying rate (unadjusted for capital servicing) | 9.92% | 9.90% | 7.02% | 9.21% | 8.86% |
| Capital servicing adjustment | -2.15% | -1.65% | -1.01% | -1.48% | -1.03% |
| Underlying rate | 7.77% | 8.25% | 6.01% | 7.73% | 7.83% |
| Rolling average* | 8.37% | 8.39% | 7.79% | 7.92% | 7.94% |
Note: The capital servicing adjustment accounts, at an aggregate level, for different levels of capital employed across the companies in the index and so sets a baseline upon which step 6 of the contract profit rate applies.
‘*’ A four-year average was used for 2022/23; a three-year average for pre-2022/23 and a three-year average (excluding 2022/23 underlying rate) for 2023/24 and 2024/25.
The pre-2020/21 underlying rates used for the three-year average were: 2018/19: 8.20% and 2019/20: 9.14%.
Data sources
For further information on the data selection approach please see section 7 of the Single Source baseline profit rate, capital servicing rates and funding adjustment methodology. A company update search of the Orbis database was carried out on 1 November 2023 on data update number 342001 using software version 342. The financial data for the calculation was extracted from Orbis at the same time.
Median capital servicing adjusted return on cost of production
Proportion of Companies by country
Proportion of companies with defence keyword
Supplementary statistics
| Number of companies | 53 |
| of which profit making | 46 |
| Aggregate turnover (£billions) | £125 |
| Total capital employed (CE) (£billions) | £59 |
| Average company CP:CE ratio | 1.89 |
Source: Orbis (Cash figures shown in rounded GBP Billions)
Names of companies in the index
| AAR Corp |
| AB Transitio * |
| Airtanker Holdings Limited |
| Airtanker Services Limited |
| Alltruck PLC |
| Applus Services, S.A. |
| Archrock, Inc. |
| Ashtead Group PLC |
| Babcock & Wilcox Enterprises, Inc. * |
| Babcock International Group PLC |
| CAE INC |
| Cowles Holdings Limited |
| Cuypers Vorkliften |
| Dawsongroup PLC |
| Finning International INC |
| Fisher (James) & Sons PLC |
| Flowserve Corp |
| Fortress Transportation and Infrastructure Investors LLC * |
| G M Treble Holdings Limited |
| Gama Aviation PLC * |
| Gatx Corp |
| General de Alquiler de Maquinaria, S.A. |
| H&E Equipment Services, Inc. |
| Indra Sistemas S.A. |
| Jacobs Solutions Inc. |
| John Wood Group PLC * (J) |
| Johnson Controls International PLC (J) |
| Kbr, Inc. |
| Mcgrath Rentcorp |
| MTU Aero Engines AG |
| Muehlhan AG |
| N3 Engine Overhaul Services GmbH & Co. KG |
| Natural GAS Services Group, Inc. * |
| Redde Northgate PLC |
| Renew Holdings PLC |
| Ricardo PLC |
| Ropsley Limited |
| RWG (Repair & Overhauls) Limited |
| Ryder System INC |
| Saltire Energy Limited |
| Sawo Holding A/S |
| Snc-Lavalin Group INC (J) |
| Speedy Hire PLC |
| Technipfmc PLC |
| Toromont Industries LTD |
| United Rentals, Inc. |
| Vegsund Slip Holding AS |
| VSE Corp |
| Werent S.R.L. |
| Westinghouse AIR Brake Technologies Corp |
| Williams Shipping Holdings Limited |
| Willis Lease Finance Corp |
| Willis Mitsui & CO Engine Support Limited * |
‘*’ Indicates that the company is a loss-maker in the year.
(J) indicates a company which was not in the group last year but has been added this year.
Under the Defence Reform Act 2014, the SSRO must provide the Secretary of State with its defence contracts and qualifying sub-contracts. Part of the methodology is the categorisation of comparator companies into five activity types.
-
- Develop and Make
-
- Provide and Maintain
-
- Ancillary Services
-
- Construction
-
- Information Technology Services
The results of these groups are separately analysed and this fact sheet describes the Ancillary Services group results.
The baseline profit rate combines results from “Develop and Make” and “Provide and Maintain”, as set out in the Recommendation Factsheet. For further information on the methodology used to calculate these rates please see the Single Source baseline profit rate, capital servicing rates and funding adjustment methodology.
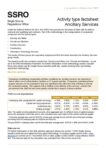
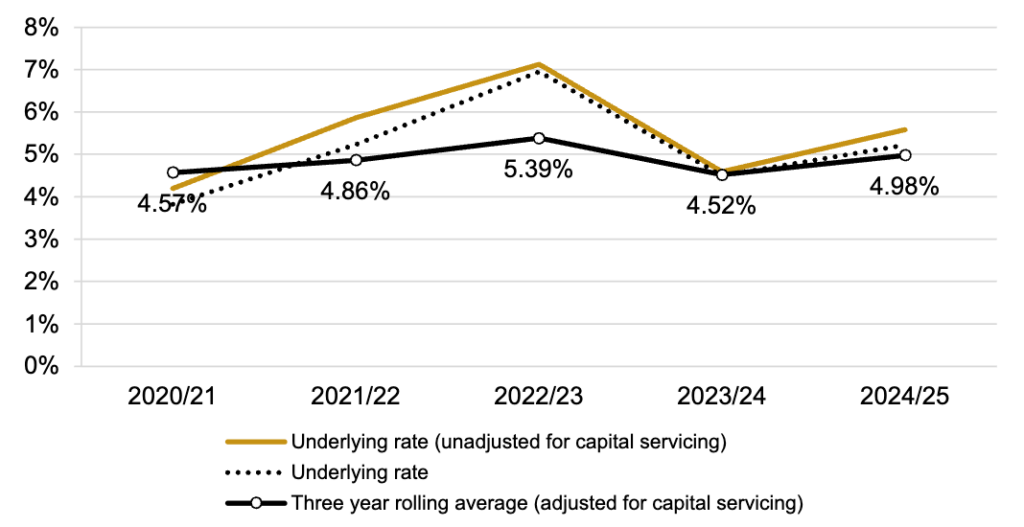
Ancillary services
Companies undertaking comparable activities considered as ‘ancillary services’ are expected to deliver either one of administrative, facilities or IT support activities. Companies undertaking these support services are not expected to bear any significant risks other than that of failing to provide the contracted outputs. This captures risk in relation to the delivery of the services, contract risk, procurement risk, staff risk and some quality control risk in respect of these activities.
Profit on cost of production
| 2020/21 | 2021/22 | 2022/23 | 2023/24 | 2024/25 | |
|---|---|---|---|---|---|
| Underlying rate (unadjusted for capital servicing) | 4.19% | 5.86% | 7.13% | 4.59% | 5.58% |
| Capital servicing adjustment | -0.37% | -0.63% | -0.18% | -0.09% | -0.36% |
| Underlying rate | 3.82% | 5.23% | 6.95% | 4.50% | 5.22% |
| Rolling average* | 4.57% | 4.86% | 5.39% | 4.52% | 4.98% |
Note: The capital servicing adjustment accounts, at an aggregate level, for different levels of capital employed across the companies in the index and so sets a baseline upon which step 6 of the contract profit rate applies.
‘*’ A four-year average was used for 2022/23; a three-year average for pre-2022/23 and a three-year average (excluding 2022/23 underlying rate) for 2023/24 and 2024/25.
The pre-2020/21 underlying rates used for the three-year average were: 2018/19: 4.35% and 2019/20: 5.54%
Data sources
For further information on the data selection approach please see section 7 of the Single Source baseline profit rate, capital servicing rates and funding adjustment methodology. A company update search of the {Orbis database](https://www.bvdinfo.com/en-gb/our-products/data/international/orbis) was carried out on 1 November 2023 on data update number 342001 using software version 342. The financial data for the calculation was extracted from Orbis at the same time.
Median capital servicing adjusted return on cost of production
Proportion of Companies by country
Proportion of companies with defence keyword
Supplementary statistics
| Number of companies | 32 |
| of which profit making | 28 |
| Aggregate turnover (£billions) | £103 |
| Total capital employed (CE) (£billions) | £9.6 |
| Average company CP:CE ratio | 9.74 |
Source: Orbis (Cash figures shown in rounded GBP Billions)
Names of companies in the index
| ABM Industries INC |
| Antac Support Services LTD |
| Aramark |
| Automatic Data Processing, Inc. |
| Building Energy Services Group Limited |
| Bulloughs Cleaning Services Limited |
| Cliner SA |
| Cloudfm Group Limited |
| Compass Group PLC |
| Conduent Incorporated * |
| Coor Service Management Holding AB |
| DWF Group PLC |
| Firstservice Corporation |
| Glenthorp Limited |
| Grupo BN, Facility Services SA. |
| Healthcare Services Group INC |
| I3 Verticals, Inc. * |
| Iron Mountain INC |
| ISS A/S |
| Kinovo PLC * |
| Lacera Servicios Y Mantenimiento SA |
| Mears Group PLC |
| Mitie Group PLC |
| Paychex INC |
| Pedersen Contracting Services LTD |
| Rentokil Initial PLC |
| Restore PLC |
| Sarastia Oy |
| Serco Group PLC |
| Servicios de Mantenimiento Y Limpieza Castor SL * |
| Trinet Group, Inc. |
| Tyler Technologies INC |
‘*’ Indicates that the company is a loss-maker in the year.
(J) Indicates a company which was not in the activity group last year, but has been added this year.
Under the Defence Reform Act 2014, the SSRO must provide the Secretary of State with its assessment of the appropriate rates used to determine the contract profit rate for pricing qualifying defence contracts and qualifying sub-contracts. Part of the methodology is the categorisation of comparator companies into five activity types.
-
- Develop and Make
-
- Provide and Maintain
-
- Ancillary Services
-
- Construction
-
- Information Technology Services
The results of these groups are separately analysed and this fact sheet describes the Construction group results.
The baseline profit rate combines results from “Develop and Make” and “Provide and Maintain”, as set out in the Recommendation Factsheet. For further information on the methodology used to calculate these rates please see the Single source baseline profit rate and capital servicing rates methodology.
Construction
Profit on cost of production
| 2020/21 | 2021/22 | 2022/23 | 2023/24 | 2024/25 | |
|---|---|---|---|---|---|
| Underlying rate (unadjusted for capital servicing) | 3.34% | 3.18% | 4.03% | 4.54% | 3.68% |
| Capital servicing adjustment | -0.27% | -0.17% | -0.29% | -0.30% | -0.18% |
| Underlying rate | 3.07% | 3.01% | 3.74% | 4.24% | 3.50% |
| Rolling average* | 3.35% | 3.19% | 3.33% | 3.44% | 3.58% |
Note: The capital servicing adjustment accounts, at an aggregate level, for different levels of capital employed across the companies in the index and so sets a baseline upon which step 6 of the contract profit rate applies.
‘*’ A four-year average was used for 2022/23; a three-year average for pre-2022/23 and a three-year average (excluding 2022/23 underlying rate) for 2023/24 and 2024/25.
The pre-2020/21 underlying rates used for the three-year average were:2018/19: 3.49% and 2019/20: 3.50%
Data sources
For further information on the data selection approach please see section 7 of the Single Source baseline profit rate, capital servicing rates and funding adjustment methodology. A company update search of the Orbis database was carried out on 1 November 2023 on data update number 342001 using software version 342. The financial data for the calculation was extracted from Orbis at the same time.
Median capital servicing adjusted return on cost of production
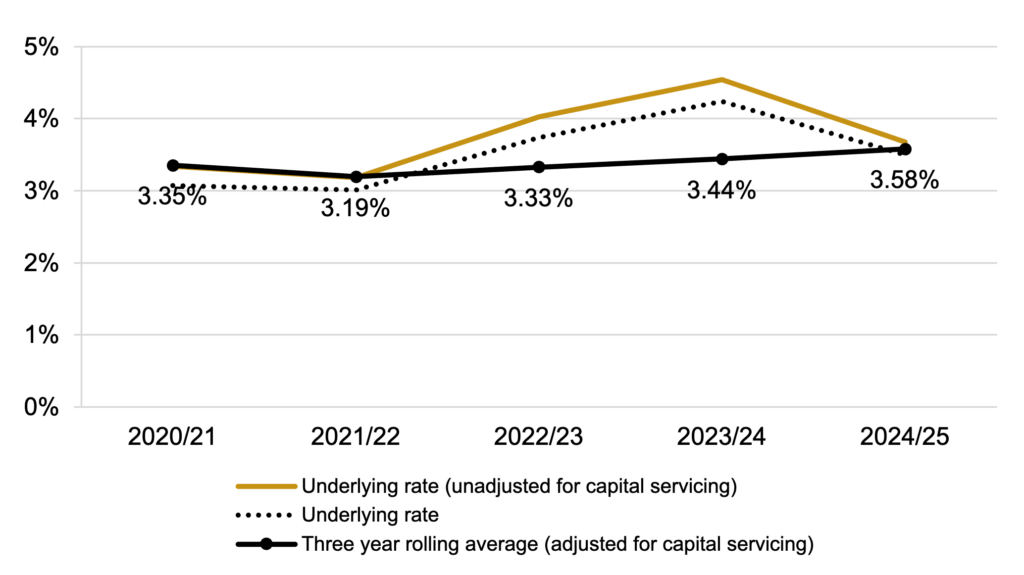
Proportion of Companies by country
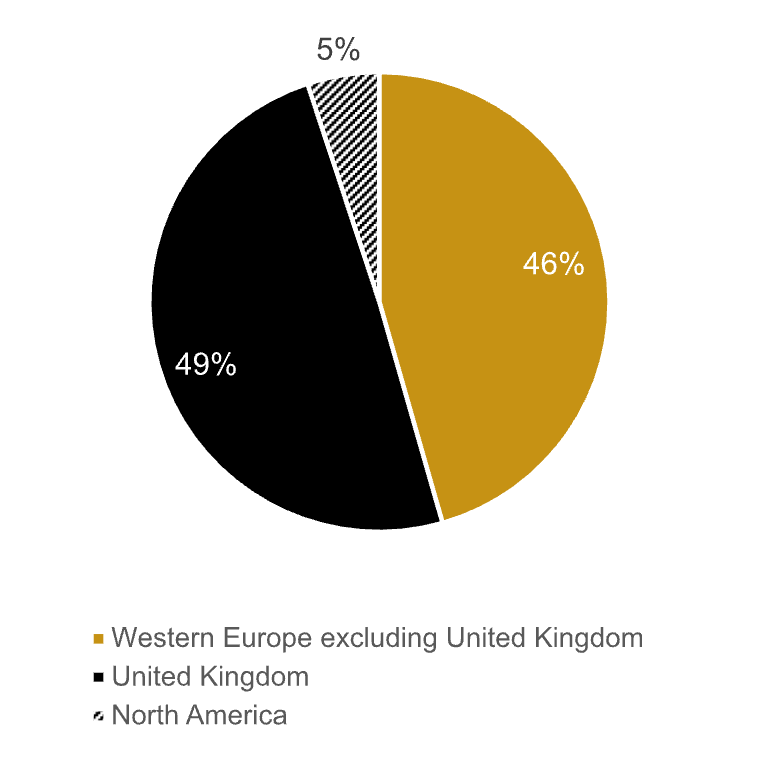
Proportion of companies with defence keyword
Supplementary statistics
| Number of companies | 91 |
| of which profit making | 79 |
| Aggregate turnover (£billions) | £155 |
| Total capital employed (CE) (£billions) | £4.0 |
| Average company CP:CE ratio | 36.02 |
Source: Orbis (Cash figures shown in rounded GBP Billions)
Names of companies in the index
| 3B Construction LTD |
| ADF Group INC |
| Aecon Group INC |
| AF Gruppen ASA |
| Ashe Group Holdings Limited |
| B&G Armatures |
| Balfour Beatty PLC |
| Bermar Building Company Limited |
| Billington Holdings PLC |
| Bird Construction Inc. |
| Bowmer and Kirkland Limited |
| Bravida Holding AB |
| Bridgetown Holdings Limited |
| Byggpartner I Dalarna Holding AB * |
| Chap (Holdings) Limited |
| Chrysalis |
| Cobelba – Sociedade de Construcao Civil, S.A. |
| Compania Levantina de Edificacion Y Obras Publicas S.A. |
| Conlon Holdings Limited |
| Consti OYJ |
| Dobloug Holding AS * |
| Duro Felguera SA * |
| E. M. Pekkinen Oy |
| Ecosoer Holding AS |
| Edimarante – Sociedade de Construcoes, S.A. |
| Elektro AS |
| Emcor Group INC |
| Emery Brothers Limited |
| EW Beard (Holdings) Limited (J) |
| Feltham Group Limited |
| Fordy Thompson (Holdings) Limited |
| Foundation Piling (Holdings) Limited * |
| Galliford TRY Holdings PLC |
| GHI Contracts Holdings Limited |
| Glasgiven Contracts Limited |
| Groupe 1000 |
| Grupo Empresarial SAN Jose S.A. |
| Haandverkskompaniet AS |
| Haley Securities Limited |
| Hardwicke Investments Limited * |
| Highgrove Group PLC * |
| Implenia AG |
| Jackson, Jackson & Sons Limited |
| John Weaver (Holdings) Limited |
| K 21 Entreprenad AB |
| Kaj Ove Madsen A/S Aarhus |
| Kier Group PLC |
| Knox & Wells Holdings Limited |
| Koninklijke BAM Groep NV |
| Lareco Infra |
| Lindum Group Limited |
| Lonsdale Holdings Limited * |
| M R Stephenson Limited |
| M.P.B. Structures LTD |
| Mace Finance Limited (J) |
| Martifer Sgps S.A. |
| Mitchellson Formwork & Civil Engineering Limited |
| Morgan Sindall Group PLC |
| Northern Bear PLC |
| Nouveaux Batisseurs Associes |
| O.T. SRL |
| OBM Construction * |
| Ohob Holdings Limited |
| Oliver Connell and SON Limited |
| Peab AB |
| Porr AG |
| Putkiwuorio Oy |
| Rakennusliike J. Malm Oy * |
| Rakennuspetaja Oy |
| Renelec Group Limited |
| Saarco AS |
| Simpson (York) Holdings Limited |
| Skanska AB |
| Sorgem Societe D Economie Mixte du VAL D Orge * |
| stahl + verbundbau gesellschaft fuer industrielles bauen m.b.H. |
| Steve Hoskin Construction Limited |
| Strabag SE |
| Subsea 7 SA |
| Tclarke PLC |
| THE Castle Building Services Organisation Limited |
| TOR Entreprenoer AS |
| Tutor Perini Corporation * |
| VAN Huele |
| Varden Gruppen AS |
| Veidekke ASA |
| Vinci |
| Wates Group Limited |
| Westcliffe Holdings Limited |
| William Hare Group Limited * |
| Winvic Group Limited |
| WYN Construction Limited |
‘*’ Indicates that the company is a loss-maker in the year.
(J) Indicates a company which was not in the activity group last year, but has been added this year.
Under the Defence Reform Act 2014, the SSRO must provide the Secretary of State with its assessment of the appropriate rates used to determine the contract profit rate for pricing qualifying defence contracts and qualifying sub-contracts. Part of the methodology is the categorisation of comparator companies into five activity types.
-
- Develop and Make
-
- Provide and Maintain
-
- Ancillary Services
-
- Construction
-
- Information Technology Services
The results of these groups are separately analysed and this fact sheet describes the Information Technology Services group results.
The baseline profit rate combines results from “Develop and Make” and “Provide and Maintain”, as set out in the Recommendation Factsheet. For further information on the methodology used to calculate these rates please see the Single Source baseline profit rate and capital servicing rates methodology.
Information Technology Services
Profit on cost of production
| 2020/21 | 2021/22 | 2022/23 | 2023/24* | 2024/2 | |
|---|---|---|---|---|---|
| Underlying rate (unadjusted for capital servicing) | 11.01% | 10.65% | 11.26% | 11.31% | 11.02% |
| Capital servicing adjustment | -0.07% | -0.03% | -0.35% | -0.11% | -0.51% |
| Underlying rate | 10.94% | 10.62% | 10.91% | 11.20% | 10.51% |
| Rolling average** | 10.51% | 10.61% | 10.92% | 10.78% |
Note: The capital servicing adjustment accounts, at an aggregate level, for different levels of capital employed across the companies in the index and so sets a baseline upon which step 6 of the contract profit rate applies.
‘*‘This was the first assessment year for this activity group. The ITS rates for 2020/21 to 2022/23 are the historical profits of the 2023/24 comparator group, as the SSRO’s methodology did not include an ITS comparator group prior to this year. All other activity type factsheets represent the profit data of the groups that were assessed in that particular year.
**A three-year average was used for 2024/25, 2023/24, 2022/23, & 2021/22
Data sources
For further information on the data selection approach please see section 7 of the Single Source baseline profit rate, capital servicing rates and funding adjustment methodology. A company update search of the Orbis database was carried out on 1 November 2023 on data update number 342001 using software version 342. The financial data for the calculation was extracted from Orbis at the same time.
Median capital servicing adjusted return on cost of production
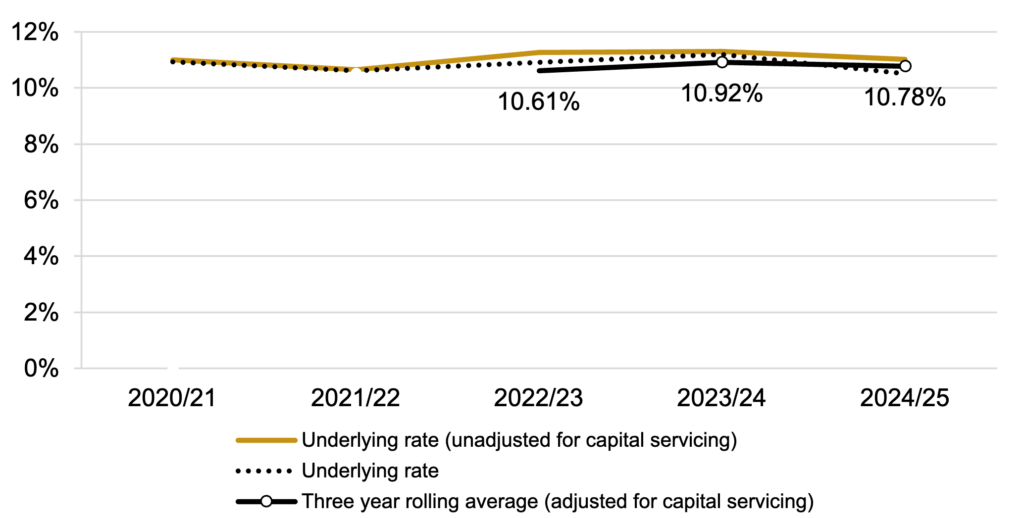
Proportion of Companies by country
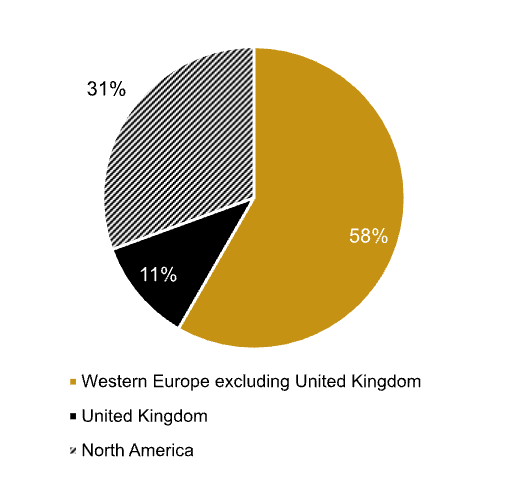
Proportion of companies with defence keyword
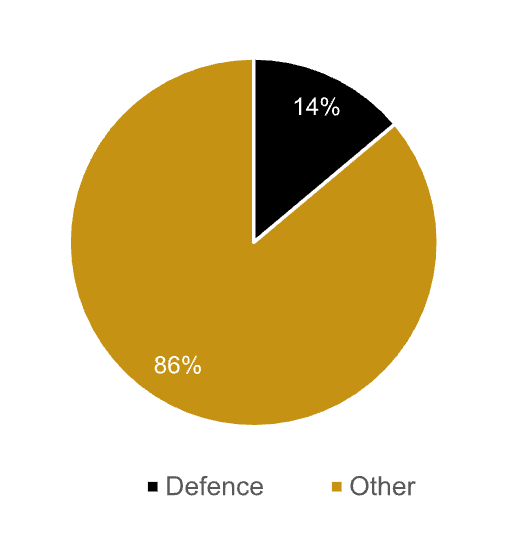
Supplementary statistics
| Number of companies | 38 |
| of which profit making | 36 |
| Aggregate turnover (£billions) | £107 |
| Total capital employed (CE) (£billions) | £0.7 |
| Average company CP:CE ratio | 127.28 |
Source: Orbis (Cash figures shown in rounded GBP Billions)
Names of companies in the index
| Accenture Public Limited Company |
| Adesso SE |
| Akamai Technologies INC |
| Allgeier SE |
| American Software INC |
| Ansys INC |
| Atos SE * (J) |
| Aubay |
| Bjss Limited |
| Bouvet ASA |
| Cancom SE |
| Ciena Corp |
| Combinedx AB |
| Digia OYJ |
| DXC Technology Company * |
| Gofore OYJ |
| Infotel |
| IT Link |
| Kainos Group PLC |
| Leidos Holdings, Inc. (J) |
| Manhattan Associates INC |
| Mensch UND Maschine Software SE |
| Mnemonic AS |
| Performance Technologies S.A |
| Proact IT Group AB |
| Progress Software Corp |
| Prosource.It (UK) Ltd. |
| PSI Software SE |
| Science Applications International Corp (J) |
| Siili Solutions OYJ |
| Sistemas Avanzados de Tecnologia, SA |
| Sopra Steria Group SA |
| Sword Group SE |
| THE Descartes Systems Group INC |
| Tracsis PLC |
| TXT E-Solutions S.P.A. |
| Vmware, Inc. |
| Zebra Technologies Corp (J) |
‘*’ Indicates that the company is a loss-maker in the year.
(J) Indicates a company which was not in the activity group last year, but has been added this year.