Under the Defence Reform Act 2014, the SSRO must provide the Secretary of State with its assessment of the appropriate rates used to determine the contract profit rate for pricing qualifying defence contracts and qualifying sub-contracts. Part of the methodology is the categorisation of comparator companies into four activity types.
- Develop, Make and Support1
- Ancillary Services
- Construction
- Information Technology Services
The results of these groups are separately analysed and this factsheet describes the Ancillary Services group results.
For further information on the methodology used to calculate these rates please see the Single Source baseline profit rate and capital servicing rates methodology.
Ancillary Services
Companies undertaking comparable activities considered as ‘Ancillary Services’ are expected to deliver either one of administrative, facilities or IT support activities. Companies undertaking these support services are not expected to bear any significant risks other than that of failing to provide the contracted outputs. This captures risk in relation to the delivery of the services, contract risk, procurement risk, staff risk and some quality control risk in respect of these activities.
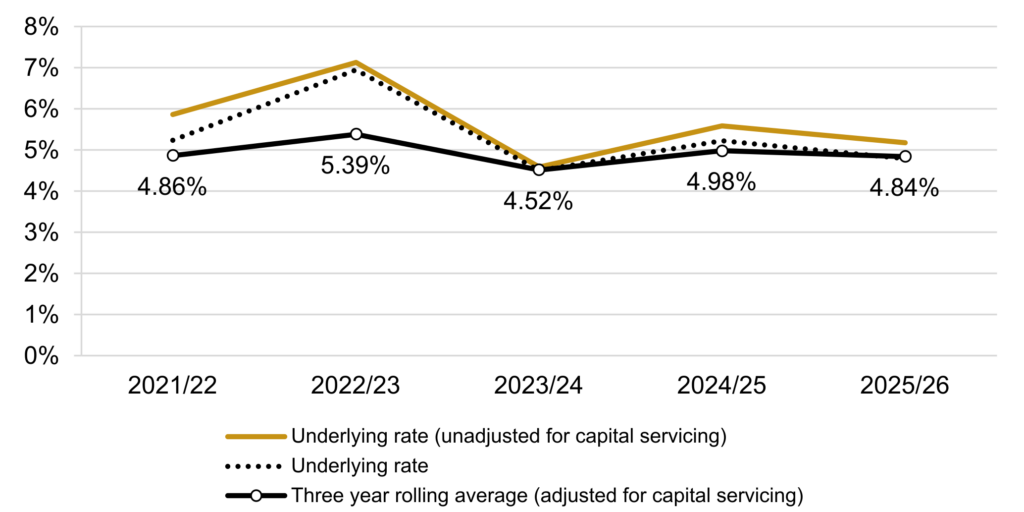
Profit on cost of production
| 2021/22 | 2022/23 | 2023/24 | 2024/25 | 2025/26 | |
|---|---|---|---|---|---|
| Underlying rate (unadjusted for capital servicing) | 5.86% | 7.13% | 4.59% | 5.58% | 5.18% |
| Capital servicing adjustment | -0.63% | -0.18% | -0.09% | -0.36% | -0.39% |
| Underlying rate | 5.23% | 6.95% | 4.50% | 5.22% | 4.79% |
| Rolling average2 | 4.86% | 5.39% | 4.52% | 4.98% | 4.84% |
Note: The capital servicing adjustment accounts, at an aggregate level, for different levels of capital employed across the companies in the index and so sets a baseline upon which step 4 of the contract profit rate applies.
Data sources
For further information on the data selection approach please see section 7 of the Single Source baseline profit rate and capital servicing rates methodology. A company update search of the Orbis database was carried out on 1 November 2024 on data update number 354001 using software version 354. The financial data for the calculation was extracted from Orbis at the same time.
Median capital servicing adjusted return on cost of production
Proportion of companies by country
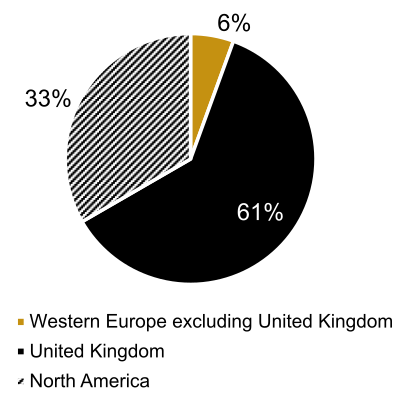
Proportion of companies by country
Supplementary statistics
| Number of companies | 22 |
|---|---|
| of which profit making | 18 |
| Aggregate turnover (£billions) | 82 |
| Total capital employed (CE) (£billions) | 4 |
| Average company CP:CE ratio | 20.84 |
Source: Orbis (Cash figures shown in rounded GBP Billions)
Names of companies in the index
| ABM Industries INC | Firstservice Corporation |
| Antac Support Services LTD | Glenthorp Limited |
| Aramark | Healthcare Services Group INC |
| Building Energy Services Group Limited | Kinovo PLC * |
| Bulloughs Cleaning Services Limited | Lacera Servicios Y Mantenimiento SA * |
| Cliner SA * | Mears Group PLC |
| Cloudfm Group Limited | Mitie Group PLC |
| Compass Group PLC | Rentokil Initial PLC |
| Conduent Incorporated * | Restore PLC |
| Coor Service Management Holding AB | Serco Group PLC |
| Corpay INC (J) | Trinet Group, Inc. |
* Indicates that the company is a loss-maker in the year.
(J) Indicates a company which was not in the activity group last year but has been added this year.
- The ‘Develop, Make and Support’ activity type replaces the previous activity types of ‘Develop and Make’ and ‘Provide and Maintain’. Further information can be found in the published Q&A document. ↩︎
- A four-year average was used for 2022/23; a three-year average for pre-2022/23 and a three-year average (excluding 2022/23 underlying rate) for 2023/24 onwards. ↩︎