
Under the Defence Reform Act 2014, the SSRO must provide the Secretary of State with its assessment of the appropriate rates used to determine the contract profit rate for pricing qualifying defence contracts and qualifying sub-contracts. For further information on the methodology used to calculate these rates please see the Single Source baseline profit rate and capital servicing rates methodology.
Baseline Profit Rate
The baseline profit rate is step 1 of the four-step process for determining the contract profit rate for a qualifying defence contract.
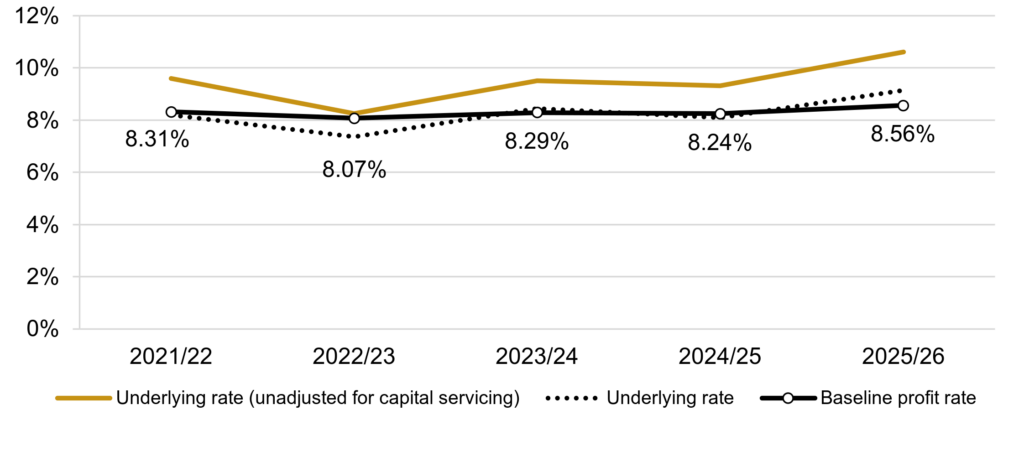
The baseline profit rate is calculated from an index of public and private companies. The underlying rate is the median capital servicing adjusted profit on cost of production of the group. The baseline profit rate is the rolling average of the underlying rate.
| 2021/22 | 2022/231 | 2023/24 | 2024/25 | 2025/26 | |
|---|---|---|---|---|---|
| Underlying rate (unadjusted for capital servicing)2 | 9.59% | 8.24% | 9.50% | 9.31% | 10.60% |
| Capital servicing adjustment | -1.40% | -0.89% | -1.06% | -1.22% | -1.46% |
| Underlying rate | 8.19% | 7.35% | 8.44% | 8.09% | 9.14% |
| Baseline profit rate recommended by the SSRO; rolling average of the underlying rate3 | 8.31% | 8.07% | 8.29% | 8.24% | 8.56% |
Note: The 2021/22 to 2024/25 rates are based on the composites of the ‘Develop and Make’ and ‘Provide and Maintain’ activity groups; while the 2025/26 rates are calculated from the ‘Develop, Make and Support’ activity group.
Median capital servicing adjusted return on cost of production
Baseline profit rate activity types
The underlying rate for 2025/26 is calculated using companies in the ‘Develop, Make & Support’ activity group. Companies undertaking comparable activities considered as ‘Develop, Make & Support’ are expected to engage in manufacturing and the design; and development contributing to that process and delivery of services to ensure the availability of an asset through repair and servicing to third party equipment. This would therefore not include manufacturing on behalf of a hiring firm that supplies the design, or those solely undertaking research or design work with no associated manufacturing. Where development activities do not seek to result in a novel or differentiated product the company is less likely to be considered comparable.
The baseline profit rates for 2016/17 to 2024/25 were a composite that combine the results from the ‘Develop and Make’ and ‘Provide and Maintain’ activity groups. For the 2025/26 rates assessment these groups are no longer assessed and have been replaced by Develop, Make and Support. The 2025/26 baseline profit rate assessment is calculated as a three-year average of FY2023* ‘Develop, Make and Support’ underlying rate, and the historical FY2022 and FY2021 composite underlying rates. Further information on this change can be found in the published Q&A document.
* FY2023 means the latest year ending on or before 31 March 2024 that is addressed by the financial statements of each comparator company. For most comparator companies this is the year ended 31 December 2023, but some company financial statements cover different time periods, for example the year ended 31 March 2024, or the year ended 30 June 2023.
Data sources
For further information on the data selection approach please see section 7 of the Single Source baseline profit rate and capital servicing rates methodology. A company update search of the Orbis database was carried out on 1 November 2024 on data update number 354001 using software version 354. The financial data for the calculation was extracted from Orbis at the same time.
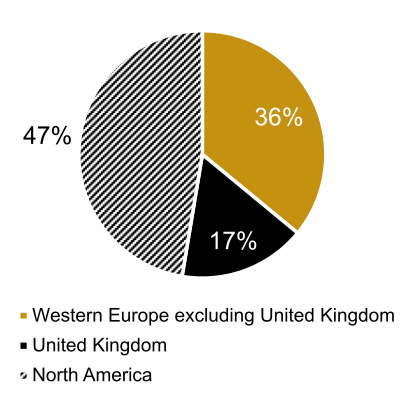
Proportion of companies by country
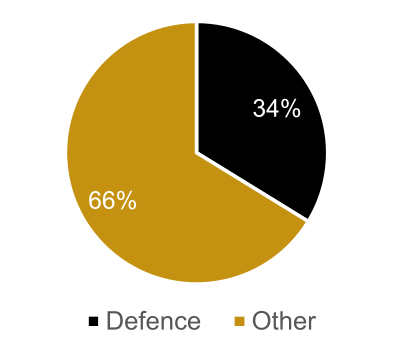
Proportion of companies with defence keyword
Supplementary statistics
| Number of companies | 261 |
| of which profit making | 228 |
| Aggregate turnover (£billions) | 1,184 |
| Total capital employed (CE) (£billions) | 275 |
| Average company CP:CE ratio | 3.80 |
Source: Orbis (Cash figures shown in rounded GBP Billions)
Names of companies in the index
| Aaon INC | John Wood Group PLC |
| AAR Corp | Johnson Controls International PLC |
| AB Volvo | Jost Werke AG |
| Accuracy International Limited * | Judges Scientific PLC |
| Aerovironment, Inc. * | Kadant INC |
| Aguirre Maquinaria Agricola SL. | Kbr, Inc. |
| AIR Industries Group * | Kesla OYJ |
| Airbus SE | Keysight Technologies, Inc. |
| Airtanker Holdings Limited | Klingelnberg AG |
| Airtanker Services Limited | Koenig UND Bauer AG |
| Alamo Group INC | Komax Holding AG |
| Alimak Group AB | Konecranes OYJ |
| Allient INC | Kratos Defense & Security Solutions, Inc. |
| Allison Transmission Holdings, Inc. | L3harris Technologies, Inc. |
| Alstom S.A | LAM Research Corp |
| American Axle & Manufacturing Hldngs INC | Leonardo S.P.A. |
| Ametek INC | Lillbacka Powerco Oy * |
| Amtech Systems INC * | Linamar Corporation |
| Analog Devices INC | Lockheed Martin Corp |
| Andritz AG | Lombardi Converting Machinery S.P.A. |
| Archrock, Inc. | Magna International INC |
| Ascent Flight Training (Holdings) Limited (J) | Manitex International, Inc. |
| Astec Industries INC | Manitou BF |
| Astronics Corporation * | Manitowoc Company, Inc. (The) |
| Astronova, Inc. | Marel HF |
| Atkinsrealis Group Inc. | Mariani Societa’ PER Azioni |
| Atlas Copco AB | Marshall of Cambridge (Holdings) Limited * (J) |
| ATS Corporation | Maschinenfabrik Berthold Hermle AG |
| Aumann AG | Mercury Systems INC * |
| Avant Tecno Oy | Mikron Holding AG |
| Avon Protection PLC * | Miller Industries INC |
| Axcelis Technologies INC | MKS Instruments INC * |
| Axon Enterprise, Inc. | Modine Manufacturing CO |
| Azkoyen SA | Moog INC |
| Babcock & Wilcox Enterprises, Inc. | Motorola Solutions, Inc. |
| Babcock International Group PLC | Mpac Group PLC |
| BAE Systems PLC | MS International PLC |
| Bailey Trailers Limited | MTU Aero Engines AG * |
| Barco NV | Nammo AS |
| Barnes Group INC | NC Engineering (Hamiltonsbawn) Limited |
| Binder + Co AG | NFI Group Inc. * |
| Bittium OYJ * | Nordson Corp |
| BK Technologies Corporation * | Northrop Grumman Corporation |
| Blue Bird Corporation | NOV INC |
| BMI Trailers Limited * | Nuova Idropress – Societa’ PER Azioni IN Forma Abbreviata NIP S.P.A. |
| Boeing Company (The) * | NVE Corporation |
| Broadwind, Inc. | Officina Bocedi SRL |
| Bruker Corporation | Officina Meccanica F.Lli Tabarelli S.P.A. |
| Brunvoll Holding AS | Onto Innovation Inc. |
| BWX Technologies Inc. | Oshkosh Corporation |
| C.M.A. – Costruzioni Montacarichi ED Ascensori – Societa’ A Responsabilita’ Limitata | Oxford Instruments PLC |
| Cactus, Inc. | Oy El-Ho Ab |
| CAE INC * | Paccar INC |
| Carver Group Limited | Park Aerospace Corp. |
| Castledon LTD | Paul Mueller Company * |
| Caterpillar INC | Ponsse OYJ |
| Ceco Environmental Corp. | Portsmouth Aviation Holdings Limited |
| Chart Industries INC | Powell Industries INC |
| Chemring Group PLC | PVA Tepla AG |
| Cicor Technologies LTD (J) | Qinetiq Group PLC |
| CMZ Machine Tool Manufacturer Sociedad Limitada. | Raute OYJ |
| CNH Industrial N.V | Renew Holdings PLC |
| Coda Octopus Group, Inc. | Renishaw PLC |
| Cognex Corp | REV Group, Inc. |
| Coherent Corp | Rheinmetall AG |
| Cohort PLC | Ricardo PLC * |
| Colosio S.R.L. | Robson Handling Technology Limited * |
| Columbus Mckinnon Corp | Rockwell Automation, Inc. |
| Commercial Vehicle Group, Inc. | Rohde & Schwarz GmbH & Co. Kommanditgesellschaft |
| Comtech Telecommunications Corp * | Rolls-Royce Holdings PLC |
| Construcciones Y Auxiliar de Ferrocarriles, S.A. | Ropsley Limited |
| Continental AG | RTX Corp |
| CPI Aerostructures INC | RWG (Repair & Overhauls) Limited |
| CTA International SAS | Saab AB |
| CTT Systems AB | Saalasti Oy |
| Cummins Inc. | Safran |
| Curtiss Wright Corp | Sawo Holding A/S |
| D.R.A. LTD * | SC Group-Global Limited |
| Data I/O Corp | Schlatter Industries AG |
| David Ritchie (Implements) Limited | Schmitt – Elevadores, LDA |
| de Lorenzo S.P.A. | Servotronics INC * |
| Deere & CO | Siemens AG |
| Deutz AG | Skako A/S |
| Douglas Dynamics, Inc. | Smiths Group PLC |
| Ducommun INC | Solid State PLC (J) |
| Duerr AG | Sonardyne Holdings Limited |
| Electromecanica Naval E Industrial SA | Spirit Aerosystems Holdings, Inc. * |
| Elettronica – Societa PER Azioni | Star Refrigeration Limited |
| Energy Recovery, Inc. | Systemair AB |
| Enerpac Tool Group Corp | TAI Milano S.P.A. |
| Espey MFG and Electronics Corp | Talleres Mecanicos DEL SUR SA |
| EVS Broadcast Equipment SA | Taylor Devices INC |
| Fabricacion de Elevadores SL * | Teagle Holdings Limited |
| Federal Signal Corp | Technipfmc PLC |
| Filtronic PLC * | Teledyne Technologies Incorporated |
| Fisher (James) & Sons PLC | Tennant CO |
| Flowserve Corp | Teradyne INC |
| Forum Energy Technologies, Inc. (J) | Terex Corp |
| Forvia SE | Tesmec SPA |
| G.H.B. (Holding) Limited | Tevo Oy * |
| Genasys Inc. * | Textron INC |
| Gencor Industries, Inc. | Thales |
| General Dynamics Corp | THE Shyft Group, Inc. * |
| General Electric Company | Thwaites Limited |
| Gentex Corp | Thyssenkrupp AG * |
| Gorman-Rupp Company (The) | Tiber Pack S.P.A. |
| Graco INC | Tomra Systems ASA |
| Graham Corp | Tornado Global Hydrovacs Ltd. |
| Greenbrier Companies, Inc. (The) | Trakm8 Holdings PLC * |
| Guzzetti S.P.A. * | Transdigm Group Incorporated |
| Heico Corp | Trinity Industries INC |
| Heidelberger Druckmaschinen AG | Triumph Group INC |
| Heroux-Devtek INC | Tronrud Engineering AS |
| Hexcel Corp | TTM Technologies INC |
| Hiden Instruments Limited | Twin Disc INC |
| Honeywell International INC | Vaisala OYJ |
| Huntington Ingalls Industries, Inc. | Veeco Instruments INC |
| Idex Corp | Vegsund Slip Holding AS |
| IMI PLC | Viridien SA |
| Indra Sistemas S.A. | VSE Corp |
| Industrias Montanesas Electricas Mecanicas SL | Wabash National Corp |
| Inficon Holding AG | Wacker Neuson SE |
| Ingersoll Rand Inc. | Wartsila OYJ |
| Innovative Solutions & Support INC | Washtec AG |
| Innovex International INC * | Westinghouse AIR Brake Technologies Corp |
| Interroll Holding AG | Wilton Universal Group Limited |
| IPG Photonics Corporation | Witt & SON UK Holdings Limited |
| Istobal SA | Woodward, Inc. |
| Italcab S.P.A. | Xylem Inc. |
| Jacobs Solutions Inc. | Zebra Technologies Corp (J) |
| John Bean Technologies Corp |
* Indicates that the company is a loss-maker in the year.
(J) indicates a company that was not in either the ‘Develop and Make’ or the ‘Provide and Maintain’ activity group last year, but has been added this year in the replacement ‘Develop, Make and Support’ activity group.
Capital servicing rates
The capital servicing rates are used as part of the Step 4 Capital Servicing Adjustment (CSA) of the four-step process for determining the contract profit rate for a qualifying defence contract. A corresponding adjustment accounts, at an aggregate level, for different levels of capital employed across the companies in the index and so sets a baseline upon which Step 4 of the contract profit rate applies.
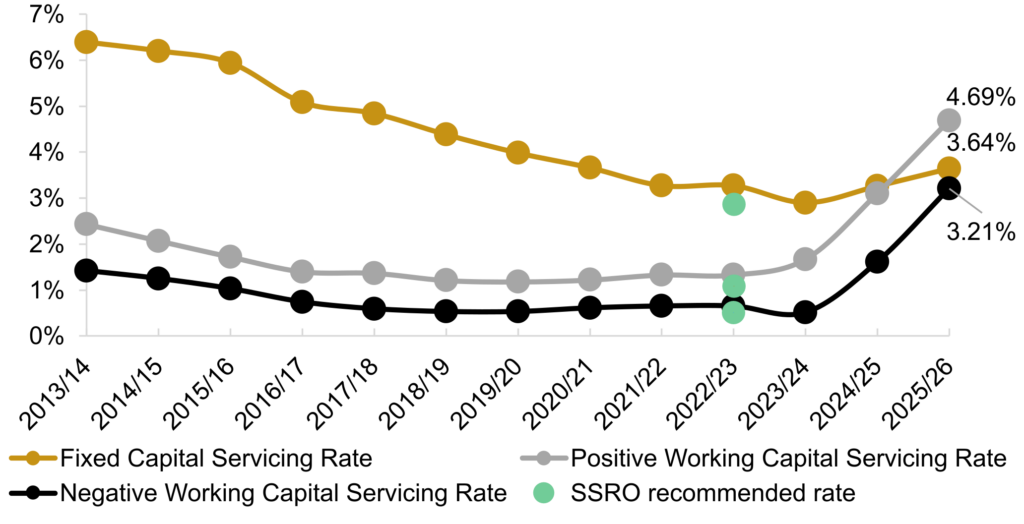
The capital servicing rates are calculated from indices of sterling denominated corporate bonds or fixed maturity deposits. The rates are rolling averages of the underlying rates.
| 2021/22 | 2022/234 | 2023/24 | 2024/25 | 2025/26 | |
|---|---|---|---|---|---|
| Fixed capital servicing rate | 3.27% | 2.87% | 2.90% | 3.26% | 3.64% |
| Positive working capital servicing rate | 1.33% | 1.09% | 1.67% | 3.10% | 4.69% |
| Negative working capital servicing rate | 0.65% | 0.51% | 0.51% | 1.61% | 3.21% |
Data sources
For further information on the data selection approach please see section 13 of the Single Source baseline profit rate and capital servicing rates methodology.
| Rate | Description | |
|---|---|---|
| Fixed capital servicing rate | Seven-year average of ’15-year BBB GBP’ bonds | BVCSGU15 BVLI Index |
| Positive working capital servicing rate | Three-year average of ‘1-year BBB GBP’ bonds | BVCSGU01 BVLI Index |
| Negative working capital servicing rate | Three-year average of Monthly average of UK resident monetary financial institutions’ (excl. Central Bank) sterling weighted average interest rate – time deposits with fixed original maturity <=1 year from private non-financial corporations (in percent) not seasonally adjusted | CFMBI32 |
Sources: Bloomberg and Bank of England
Trends in capital servicing rates
Government owned contractor rate
The government owned contractor rate is a baseline profit rate that may be applied to qualifying contracts in place of the baseline profit rate set out on page 1.
The government owned contractor rate must only apply to qualifying defence contracts where:
- the contract is between Secretary of State and a company incorporated under the Companies Act that is wholly owned by the UK Government; and
- both parties to the contract agree that it should apply.
| 2021/22 | 2022/23 | 2023/24 | 2024/25 | 2025/26 | |
|---|---|---|---|---|---|
| Government owned contractor rate | 0.057%5 | 0.046% | 0.038% | 0.00% | 0.00% |
Note: The government owned contractor rate was first introduced for 2021/22.
Calculation of government owned contractor rate
The government owned contractor rate is set to enable a contract profit rated of zero for contracts with companies wholly owned by the Secretary of State.
Prior to 2024/25 the government owned contractor rate was set at a level that is opposite to the application of the SSRO funding adjustment. For 2024/25 onwards, Schedule 10 of the Procurement Act 2023 has come into force removing the SSRO funding adjustment from the previous six-step contract profit rate process, meaning the government contractor rate is now set at zero.
- Shown are the 2022/23 rates recommended by the SSRO. The Secretary of State determined the BPR for 2022/23 as an average of the composite underlying rates calculated by the SSRO for the three years prior to 2021 (8.50%, 8.23%, and 8.19%), keeping the BPR at 8.31 per cent. ↩︎
- The capital servicing adjustment accounts, at an aggregate level, for different levels of capital employed across the companies in the index and so sets a baseline upon which step 4 of the contract profit rate applies. ↩︎
- A four-year average was used for 2022/23; a three-year average for pre-2022/23 and a three-year average (excluding the 2022/23 underlying rate) for 2023/24 onwards. The pre-2021/22 underlying rates used for the three-year average were: 2019/20: 8.50%, 2020/21: 8.23%. ↩︎
- Shown are the 2022/23 rates recommended by the SSRO. The Secretary of State determined the BPR for 2022/23 as an average of the composite underlying rates calculated by the SSRO for the three years prior to 2021 (8.50%, 8.23%, and 8.19%), keeping the BPR at 8.31 per cent. This fixed the capital servicing rates the same as for 2021/22. ↩︎
- The SSRO did not recommend a government owned contractor rate for 2021/22 and the rate was assessed by the Secretary of State. The reason for doing so is set out in the London Gazette: https://www.thegazette.co.uk/notice/3760612. ↩︎